## Diagram: Process Flow for Context-aware Inference Acceleration
### Overview
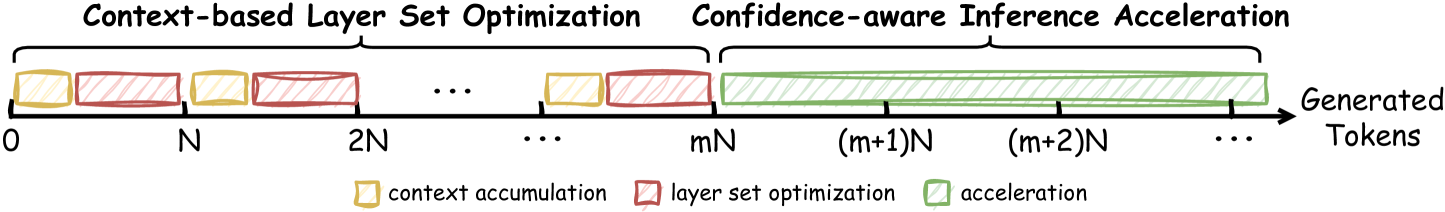
The diagram illustrates a sequential workflow for generating tokens through three distinct phases: **Context-based Layer Set Optimization**, **Confidence-aware Inference Acceleration**, and **Generated Tokens**. The timeline is divided into discrete intervals labeled as multiples of `N` (e.g., `0`, `N`, `2N`, ..., `mN`, `(m+1)N`, `(m+2)N`), with colored blocks representing computational stages.
---
### Components/Axes
- **X-axis**: Time intervals marked as `0`, `N`, `2N`, ..., `mN`, `(m+1)N`, `(m+2)N`, ..., with ellipses (`...`) indicating continuation.
- **Y-axis**: Implicitly represents computational stages (no explicit label).
- **Legend**:
- **Yellow**: Context accumulation
- **Red**: Layer set optimization
- **Green**: Acceleration
- **Key Elements**:
- Colored blocks (rectangles) aligned along the timeline.
- Arrow labeled "Generated Tokens" pointing rightward from the final phase.
---
### Detailed Analysis
1. **Phase 1: Context-based Layer Set Optimization (0 to mN)**:
- Alternating yellow (context accumulation) and red (layer set optimization) blocks.
- Blocks are evenly spaced at intervals of `N` (e.g., `0→N→2N→...→mN`).
- Example: At `0`, a yellow block precedes a red block; this pattern repeats until `mN`.
2. **Phase 2: Confidence-aware Inference Acceleration ((m+1)N onward)**:
- A single continuous green block spans from `(m+1)N` to `(m+2)N` and beyond, indicated by ellipses.
- No further yellow or red blocks appear in this phase.
3. **Output**:
- An arrow labeled "Generated Tokens" originates from the end of the green block, pointing rightward.
---
### Key Observations
- **Sequential Dependency**: The workflow progresses strictly from left to right, with no overlap between phases.
- **Color Consistency**: All blocks match the legend (yellow = context, red = optimization, green = acceleration).
- **Temporal Granularity**: The use of `N` intervals suggests modular computation steps, with acceleration occurring after `m` optimization cycles.
---
### Interpretation
This diagram represents a **pipeline for efficient token generation** in a machine learning or NLP context. The initial phases focus on optimizing computational resources (context accumulation and layer selection), followed by a sustained acceleration phase that prioritizes confidence-aware inference. The final output ("Generated Tokens") implies the culmination of these stages into actionable results. The absence of numerical values suggests the diagram emphasizes **process structure** over quantitative metrics, likely serving as a conceptual model for system design or optimization strategies.