## Line Chart: Spectral Entropy Gradient (Q-Projection)
### Overview
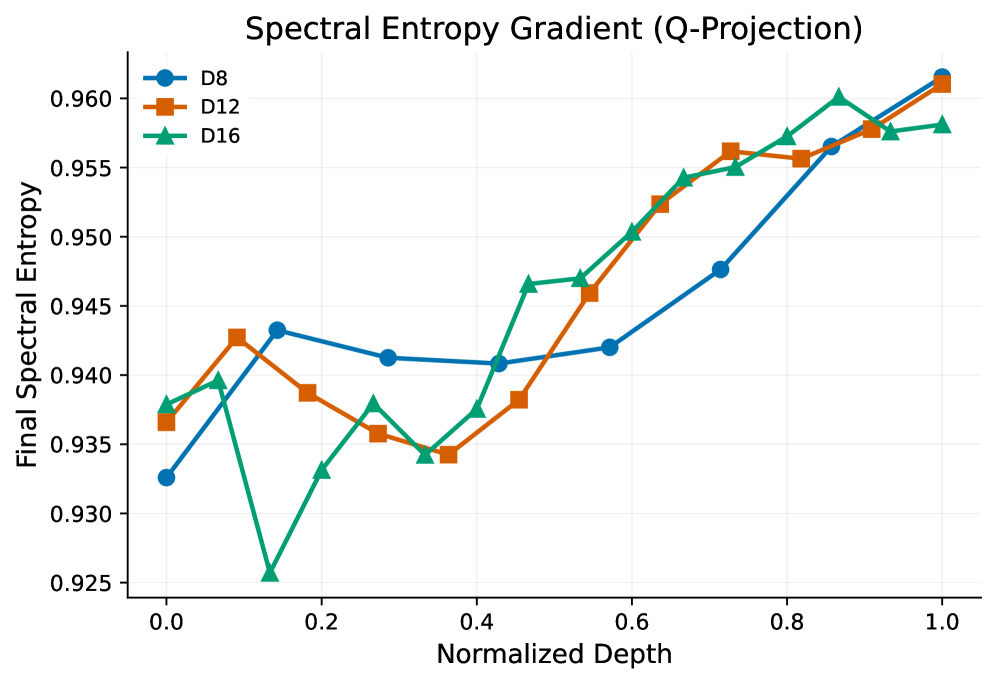
The chart visualizes the relationship between normalized depth (x-axis) and final spectral entropy (y-axis) for three datasets (D8, D12, D16). All three datasets show increasing entropy with depth, though with distinct patterns. The y-axis ranges from 0.925 to 0.960, while the x-axis spans 0.0 to 1.0 in normalized depth units.
### Components/Axes
- **X-axis (Normalized Depth)**:
- Scale: 0.0 → 1.0 in 0.2 increments
- Labels: 0.0, 0.2, 0.4, 0.6, 0.8, 1.0
- **Y-axis (Final Spectral Entropy)**:
- Scale: 0.925 → 0.960 in 0.005 increments
- Labels: 0.925, 0.930, 0.935, 0.940, 0.945, 0.950, 0.955, 0.960
- **Legend**:
- Position: Top-left corner
- Entries:
- D8: Blue circles (●)
- D12: Orange squares (■)
- D16: Green triangles (▲)
### Detailed Analysis
1. **D8 (Blue Line)**:
- Starts at ~0.932 at 0.0 depth
- Peaks at ~0.943 at 0.1 depth
- Dips slightly to ~0.941 at 0.3 depth
- Rises steadily to ~0.961 at 1.0 depth
- Final value exceeds y-axis maximum (0.960), suggesting extrapolation
2. **D12 (Orange Line)**:
- Begins at ~0.937 at 0.0 depth
- Fluctuates between ~0.935–0.943 until 0.5 depth
- Accelerates upward to ~0.961 at 1.0 depth
- Shows sharper increase in final segment (0.7–1.0)
3. **D16 (Green Line)**:
- Starts at ~0.938 at 0.0 depth
- Sharp dip to ~0.925 at 0.3 depth (lowest point)
- Recovers to ~0.959 at 1.0 depth
- Exhibits volatility in mid-depth range (0.4–0.7)
### Key Observations
- **Convergence**: All datasets reach ~0.961 at 1.0 depth, despite divergent paths
- **Anomaly**: D16 shows a significant entropy drop at 0.3 depth (0.925), unlike other datasets
- **Rate Differences**: D8 and D12 exhibit smoother increases, while D16 has pronounced fluctuations
- **Axis Limitation**: Final values exceed y-axis upper bound (0.960), indicating potential data truncation
### Interpretation
The data suggests that spectral entropy increases with normalized depth across all datasets, but with distinct behavioral patterns:
- **D8**: Most consistent growth, minimal mid-depth fluctuations
- **D12**: Moderate volatility early on, accelerating toward maximum depth
- **D16**: Unusual mid-depth entropy drop (0.925 at 0.3), followed by recovery
The Q-Projection methodology appears to amplify entropy gradients at higher depths, with D16's anomalous behavior potentially indicating unique spectral characteristics or measurement artifacts. The convergence at 1.0 depth implies a shared upper limit in entropy measurement across datasets, despite differing intermediate trajectories.