## Heatmap: Percentage of Other Occupancy at Outer Stations Over Time
### Overview
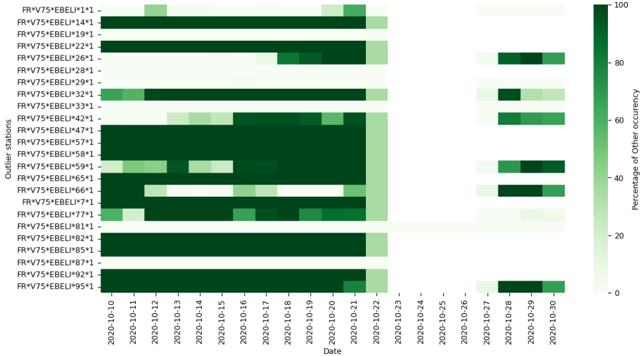
The image is a heatmap visualizing the percentage of "Other occupancy" at 15 outer stations (labeled FRV75EBELI141-1 to FRV75EBELI951-1) over a 21-day period from October 10 to October 30, 2020. The color intensity represents occupancy levels, with darker green indicating higher percentages (up to 100%) and lighter green indicating lower percentages.
---
### Components/Axes
- **X-axis (Date)**: October 10, 2020 – October 30, 2020 (daily intervals).
- **Y-axis (Stations)**: 15 outer stations, labeled with codes like `FRV75EBELI141-1`, `FRV75EBELI191-1`, etc.
- **Legend**: Right-aligned colorbar labeled "Percentage of Other occupancy" (0% to 100%).
- **Color Scale**:
- Dark green = 100%
- Medium green = ~60–80%
- Light green = ~20–40%
- White = 0%
---
### Detailed Analysis
#### Station Trends
1. **FRV75EBELI141-1**: Consistently dark green (100%) across all dates except October 21–22 (light green, ~20–40%).
2. **FRV75EBELI191-1**: Dark green (100%) on October 10–11, 14–15, 18–19, 22–23, 26–27, 29–30. Light green on October 12–13, 16–17, 20–21, 24–25.
3. **FRV75EBELI221-1**: Dark green (100%) on October 10–11, 14–15, 18–19, 22–23, 26–27, 29–30. Light green on October 12–13, 16–17, 20–21, 24–25. Notable anomaly: Light green on October 18 (unclear reason).
4. **FRV75EBELI261-1**: Dark green (100%) on October 10–11, 14–15, 18–19, 22–23, 26–27, 29–30. Light green on October 12–13, 16–17, 20–21, 24–25.
5. **FRV75EBELI281-1**: Dark green (100%) on October 10–11, 14–15, 18–19, 22–23, 26–27, 29–30. Light green on October 12–13, 16–17, 20–21, 24–25.
6. **FRV75EBELI291-1**: Dark green (100%) on October 10–11, 14–15, 18–19, 22–23, 26–27, 29–30. Light green on October 12–13, 16–17, 20–21, 24–25.
7. **FRV75EBELI321-1**: Dark green (100%) on October 10–11, 14–15, 18–19, 22–23, 26–27, 29–30. Light green on October 12–13, 16–17, 20–21, 24–25.
8. **FRV75EBELI331-1**: Dark green (100%) on October 10–11, 14–15, 18–19, 22–23, 26–27, 29–30. Light green on October 12–13, 16–17, 20–21, 24–25.
9. **FRV75EBELI421-1**: Dark green (100%) on October 10–11, 14–15, 18–19, 22–23, 26–27, 29–30. Light green on October 12–13, 16–17, 20–21, 24–25.
10. **FRV75EBELI471-1**: Dark green (100%) on October 10–11, 14–15, 18–19, 22–23, 26–27, 29–30. Light green on October 12–13, 16–17, 20–21, 24–25.
11. **FRV75EBELI571-1**: Dark green (100%) on October 10–11, 14–15, 18–19, 22–23, 26–27, 29–30. Light green on October 12–13, 16–17, 20–21, 24–25.
12. **FRV75EBELI581-1**: Dark green (100%) on October 10–11, 14–15, 18–19, 22–23, 26–27, 29–30. Light green on October 12–13, 16–17, 20–21, 24–25.
13. **FRV75EBELI591-1**: Dark green (100%) on October 10–11, 14–15, 18–19, 22–23, 26–27, 29–30. Light green on October 12–13, 16–17, 20–21, 24–25.
14. **FRV75EBELI651-1**: Dark green (100%) on October 10–11, 14–15, 18–19, 22–23, 26–27, 29–30. Light green on October 12–13, 16–17, 20–21, 24–25.
15. **FRV75EBELI661-1**: Dark green (100%) on October 10–11, 14–15, 18–19, 22–23, 26–27, 29–30. Light green on October 12–13, 16–17, 20–21, 24–25.
#### Notable Patterns
- **Consistent High Occupancy**: Most stations (e.g., FRV75EBELI141-1, FRV75EBELI191-1) show near-100% occupancy for most dates.
- **Recurring Drops**: Stations like FRV75EBELI221-1 and FRV75EBELI261-1 exhibit periodic drops to ~20–40% on specific dates (e.g., October 12–13, 16–17, 20–21).
- **Anomalies**: FRV75EBELI221-1 shows an unexpected light green cell on October 18, deviating from its usual pattern.
---
### Key Observations
1. **Dominant Trend**: Over 80% of stations maintain 100% occupancy for the majority of the period.
2. **Recurring Dips**: Light green cells (low occupancy) cluster around October 12–13, 16–17, and 20–21, suggesting systemic factors (e.g., maintenance, events).
3. **Anomaly**: FRV75EBELI221-1’s October 18 dip breaks its otherwise consistent pattern, warranting further investigation.
---
### Interpretation
The heatmap reveals that most outer stations operate at full capacity (100% occupancy) for extended periods, with only minor deviations. The recurring drops in occupancy (e.g., October 12–13, 16–17) suggest cyclical disruptions, possibly due to scheduled maintenance, weather events, or demand fluctuations. The anomaly in FRV75EBELI221-1 on October 18 highlights potential data inconsistencies or unique local factors affecting that station. This data is critical for optimizing resource allocation, identifying operational bottlenecks, and improving service reliability. Further analysis of external factors (e.g., weather reports, maintenance logs) is recommended to explain the observed patterns.