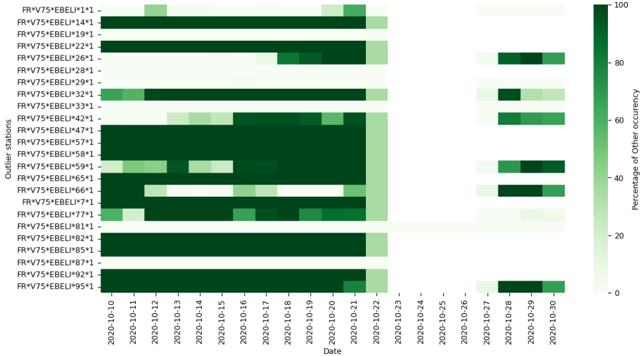
## Heatmap: Outlier Stations Percentage of Other Occurrences
### Overview
The image is a heatmap visualizing the percentage of other occurrences for various outlier stations over time, spanning from October 10, 2020, to October 30, 2020. The heatmap uses a green color gradient to represent the percentage values, with darker shades indicating higher percentages.
### Components/Axes
* **Y-axis:** "Outlier stations" listing stations with labels like "FR+V75\*EBELI\*1\*1 -", "FR+V75+EBELI\*14\*1", and so on. There are 24 stations listed.
* **X-axis:** "Date" ranging from "2020-10-10" to "2020-10-30".
* **Color Legend:** Located on the right side, showing a green gradient from light to dark, representing "Percentage of Other occurency" from 0 to 100. The legend has tick marks at 0, 20, 40, 60, 80, and 100.
### Detailed Analysis
The heatmap displays the percentage of other occurrences for each outlier station on each day. The color intensity indicates the percentage value.
Here's a breakdown of some of the stations and their trends:
* **FR+V75\*EBELI\*1\*1 -:** Shows a high percentage (dark green) on 2020-10-21, and a lighter green on 2020-10-22.
* **FR+V75+EBELI\*14\*1:** Shows a high percentage (dark green) on 2020-10-10, and a lighter green on 2020-10-11.
* **FR+V75+EBELI\*19\*1:** Shows a high percentage (dark green) on 2020-10-10, and a lighter green on 2020-10-11.
* **FR+V75 EBELI\*22\*1:** Shows a high percentage (dark green) on 2020-10-10, and a lighter green on 2020-10-11.
* **FR+V75 EBELI\*26\*1:** Shows a high percentage (dark green) on 2020-10-10, and a lighter green on 2020-10-11.
* **FR\*V75+EBELI\*28\*1:** Shows a high percentage (dark green) on 2020-10-27, 2020-10-28, and 2020-10-29.
* **FR+V75 EBELI\*29\*1:** Shows a high percentage (dark green) on 2020-10-27, 2020-10-28, and 2020-10-29.
* **FR+V75 EBELI\*32\*1:** Shows a high percentage (dark green) on 2020-10-27, 2020-10-28, and 2020-10-29.
* **FR+V75 EBELI\*33\*1:** Shows a high percentage (dark green) on 2020-10-10, and a lighter green on 2020-10-11.
* **FR\*V75+EBELI\*42\*1:** Shows a high percentage (dark green) on 2020-10-21, and a lighter green on 2020-10-22.
* **FR+V75+EBELI\*47\*1:** Shows a high percentage (dark green) on 2020-10-21, and a lighter green on 2020-10-22.
* **FR+V75+EBELI\*57\*1:** Shows a high percentage (dark green) on 2020-10-10, and a lighter green on 2020-10-11.
* **FR+V75 EBELI\*58\*1:** Shows a high percentage (dark green) on 2020-10-10, and a lighter green on 2020-10-11.
* **FR\*V75+EBELI\*59\*1:** Shows a high percentage (dark green) on 2020-10-27, 2020-10-28, and 2020-10-29.
* **FR+V75+EBELI\*65\*1:** Shows a high percentage (dark green) on 2020-10-10, and a lighter green on 2020-10-11.
* **FR+V75+EBELI\*66\*1:** Shows a high percentage (dark green) on 2020-10-27, 2020-10-28, and 2020-10-29.
* **FR V75 EBELI\*7\*1:** Shows a high percentage (dark green) on 2020-10-10, and a lighter green on 2020-10-11.
* **FR\*V75+EBELI\*77\*1:** Shows a high percentage (dark green) on 2020-10-10, and a lighter green on 2020-10-11.
* **FR\*V75+EBELI\*81\*1 -:** Shows a high percentage (dark green) on 2020-10-10, and a lighter green on 2020-10-11.
* **FR+V75+EBELI\*82\*1:** Shows a high percentage (dark green) on 2020-10-10, and a lighter green on 2020-10-11.
* **FR V75 EBELI\*85\*1:** Shows a high percentage (dark green) on 2020-10-10, and a lighter green on 2020-10-11.
* **FR+V75+EBELI\*87\*1:** Shows a high percentage (dark green) on 2020-10-10, and a lighter green on 2020-10-11.
* **FR\*V75\*EBELI\*92\*1:** Shows a high percentage (dark green) on 2020-10-10, and a lighter green on 2020-10-11.
* **FR+V75\*EBELI\*95\*1:** Shows a high percentage (dark green) on 2020-10-21, and a lighter green on 2020-10-22.
### Key Observations
* Several stations show high percentages of other occurrences around October 10-11 and October 21-22.
* Some stations show high percentages of other occurrences around October 27-29.
* The heatmap provides a visual representation of the temporal distribution of other occurrences for each station.
### Interpretation
The heatmap visualizes the percentage of other occurrences for different outlier stations over a period of time. The variations in color intensity indicate changes in the percentage of other occurrences. The data suggests that certain stations experience higher percentages of other occurrences during specific periods, potentially indicating anomalies or unusual events at those locations during those times. The heatmap allows for easy identification of stations and time periods with the highest percentage of other occurrences, which could be further investigated to understand the underlying causes.