TECHNICAL ASSET FINGERPRINT
03022fae787c8915d2e58703
Click to view fullscreen
Press ESC or click to close
FOUND IN PAPERS
EXPERT: healer-alpha-free VERSION 1
RUNTIME: free/openrouter/healer-alpha
INTEL_VERIFIED
## Heatmap Chart: Outlier Status Over Time (October 2020)
### Overview
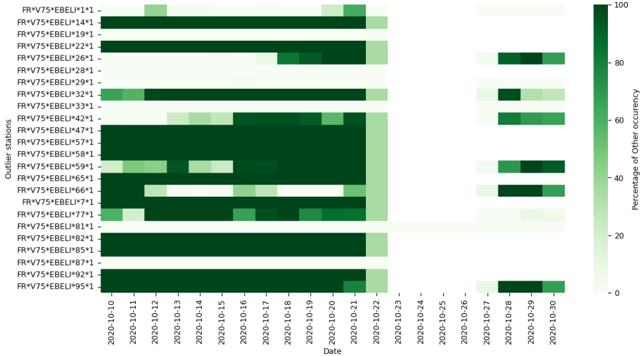
This image is a heatmap chart visualizing the temporal occurrence of various "Outlier Status" codes over the month of October 2020. The chart uses a color gradient to represent the "Percentage of Other occurrences" for each status on each day. The primary language in the chart is English.
### Components/Axes
* **Chart Type:** Heatmap (Temporal Grid).
* **Y-Axis (Vertical):** Labeled "Outlier Status". It lists 22 distinct categorical codes. From top to bottom, they are:
1. `FR~V75~EBELM1*1`
2. `FR~V75~EBELM14*1`
3. `FR~V75~EBELM15*1`
4. `FR~V75~EBELM22*1`
5. `FR~V75~EBELM26*1`
6. `FR~V75~EBELM28*1`
7. `FR~V75~EBELM32*1`
8. `FR~V75~EBELM33*1`
9. `FR~V75~EBELM42*1`
10. `FR~V75~EBELM46*1`
11. `FR~V75~EBELM57*1`
12. `FR~V75~EBELM58*1`
13. `FR~V75~EBELM59*1`
14. `FR~V75~EBELM62*1`
15. `FR~V75~EBELM66*1`
16. `FR~V75~EBELM71*1`
17. `FR~V75~EBELM77*1`
18. `FR~V75~EBELM78*1`
19. `FR~V75~EBELM82*1`
20. `FR~V75~EBELM85*1`
21. `FR~V75~EBELM87*1`
22. `FR~V75~EBELM95*1`
* **X-Axis (Horizontal):** Labeled "Date". It displays daily dates from `2020-10-10` to `2020-10-30`. The dates are listed vertically for readability.
* **Legend/Color Scale:** Positioned on the far right. It is a vertical color bar labeled "Percentage of Other occurrences". The scale runs from 0 (bottom, very light green/white) to 100 (top, dark forest green). Key markers are at 0, 20, 40, 60, 80, and 100.
* **Data Grid:** The main area is a grid where each cell corresponds to a specific Outlier Status (row) and Date (column). The cell's color indicates the percentage value.
### Detailed Analysis
The heatmap shows significant variation in the occurrence percentages across different outlier statuses and dates.
**Trend Verification & Data Point Extraction (by Row):**
* **Persistent High-Occurrence Rows (Dark Green Bands):** Several rows show consistently dark green cells across most dates, indicating a high percentage (approx. 80-100%) of "Other occurrences."
* `FR~V75~EBELM1*1`: Very dark green from Oct 10-22, then lighter.
* `FR~V75~EBELM14*1`: Consistently dark green across the entire period.
* `FR~V75~EBELM15*1`: Consistently dark green.
* `FR~V75~EBELM22*1`: Consistently dark green.
* `FR~V75~EBELM32*1`: Consistently dark green.
* `FR~V75~EBELM46*1`: Consistently dark green.
* `FR~V75~EBELM57*1`: Consistently dark green.
* `FR~V75~EBELM58*1`: Consistently dark green.
* `FR~V75~EBELM62*1`: Consistently dark green.
* `FR~V75~EBELM78*1`: Consistently dark green.
* `FR~V75~EBELM82*1`: Consistently dark green.
* `FR~V75~EBELM85*1`: Consistently dark green.
* `FR~V75~EBELM87*1`: Consistently dark green.
* `FR~V75~EBELM95*1`: Consistently dark green.
* **Sporadic or Low-Occurrence Rows:** Other rows show lighter colors or blank (white) cells, indicating low or zero percent occurrence.
* `FR~V75~EBELM26*1`: Mostly light/white, with a notable dark green cluster (approx. 80-100%) from Oct 27-30.
* `FR~V75~EBELM28*1`: Mostly light/white, with a dark green cluster (approx. 80-100%) from Oct 27-30.
* `FR~V75~EBELM33*1`: Mixed. Light green (20-40%) early in the month, then a dark green cluster (approx. 80-100%) from Oct 27-30.
* `FR~V75~EBELM42*1`: Mostly light green (20-40%) with some darker patches.
* `FR~V75~EBELM59*1`: Mostly light/white, with a dark green cluster (approx. 80-100%) from Oct 27-30.
* `FR~V75~EBELM66*1`: Mostly light/white, with a dark green cluster (approx. 80-100%) from Oct 27-30.
* `FR~V75~EBELM71*1`: Mostly light/white, with a dark green cluster (approx. 80-100%) from Oct 27-30.
* `FR~V75~EBELM77*1`: Mostly light/white, with a dark green cluster (approx. 80-100%) from Oct 27-30.
* **Temporal Pattern:** A very clear pattern emerges in the last four days of the chart (Oct 27-30). A specific set of outlier statuses (`...26*1`, `...28*1`, `...33*1`, `...59*1`, `...66*1`, `...71*1`, `...77*1`) that were previously low-activity suddenly show a synchronized spike to very high percentages (dark green).
### Key Observations
1. **Bimodal Distribution:** The outlier statuses fall into two clear groups: a large set that is persistently active (high percentage) throughout the month, and a smaller set that is mostly inactive until a sudden, synchronized activation at the end of the month.
2. **End-of-Month Anomaly:** The period from October 27 to October 30 shows a distinct event where multiple previously quiet outlier statuses become highly active simultaneously.
3. **Data Gaps:** The columns for `2020-10-23`, `2020-10-24`, `2020-10-25`, and `2020-10-26` appear completely blank (white) for all rows. This could indicate missing data, a system outage, or a period with 0% occurrence for all tracked outliers.
4. **Color Scale Interpretation:** The darkest green represents ~100%, and the lightest green/white represents ~0%. Most "active" cells are at the extreme dark end of the scale.
### Interpretation
This heatmap likely tracks the occurrence of specific error codes, system alerts, or anomaly types ("Outlier Status") within a technical system over time. The "Percentage of Other occurrences" metric suggests it measures how often this specific outlier was observed relative to all other outliers on that day.
* **What the data suggests:** The system has a baseline of several constantly occurring outlier types (the persistent dark green rows). The synchronized spike at the end of the month indicates a significant system event or change that triggered a specific subset of outlier types that are normally rare. This could point to a software deployment, configuration change, infrastructure issue, or external attack that began around October 27.
* **Relationship between elements:** The y-axis categories are the monitored conditions. The x-axis is the timeline. The color intensity is the normalized frequency. The blank period (Oct 23-26) is critical—it separates the stable baseline period from the anomalous event period. The event is not a gradual increase but a sharp, coordinated onset.
* **Notable anomalies:** The most striking anomaly is the **temporal cluster of high activity from Oct 27-30** for the specific subset of statuses. This is not random noise; it's a correlated pattern suggesting a common root cause. The complete lack of data for Oct 23-26 is another major anomaly that requires investigation—it may be the cause or a precursor to the subsequent event. The persistent high activity of the other statuses suggests they are either common, non-critical warnings or indicators of a chronic system condition.
DECODING INTELLIGENCE...