\n
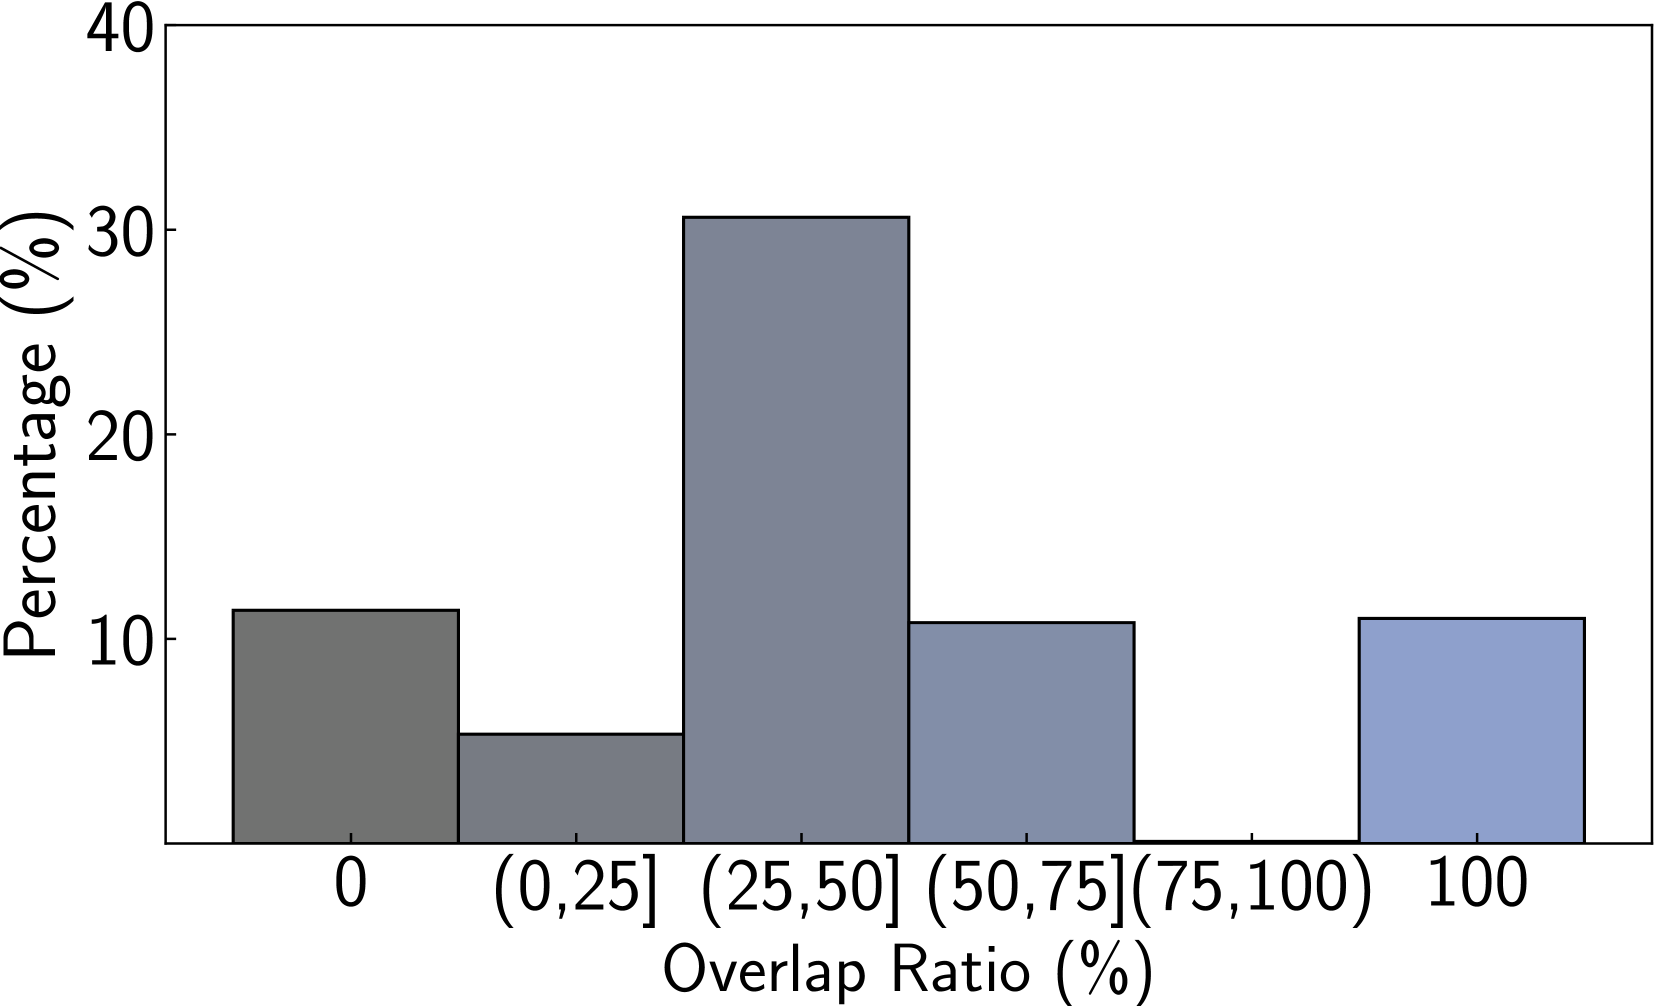
## Histogram: Overlap Ratio Distribution
### Overview
The image presents a histogram illustrating the distribution of overlap ratios, expressed as percentages. The x-axis represents the overlap ratio, categorized into bins, while the y-axis represents the percentage of occurrences within each bin.
### Components/Axes
* **X-axis Title:** "Overlap Ratio (%)"
* **Y-axis Title:** "Percentage (%)"
* **X-axis Categories (Bins):** 0, (0,25], (25,50], (50,75], (75,100], 100
* **Y-axis Scale:** 0 to 40 (approximately)
* **Bars:** Represent the percentage of overlap ratios falling within each bin. The bars are colored in shades of blue and gray.
### Detailed Analysis
The histogram displays the following approximate data points:
* **0% Overlap:** Approximately 12%
* **(0, 25]% Overlap:** Approximately 5%
* **(25, 50]% Overlap:** Approximately 32%
* **(50, 75]% Overlap:** Approximately 12%
* **(75, 100]% Overlap:** Approximately 12%
* **100% Overlap:** Approximately 11%
The tallest bar, representing the (25, 50]% overlap ratio, indicates that the highest concentration of overlap ratios falls within this range. The bars generally decrease in height as the overlap ratio moves away from this peak.
### Key Observations
* The distribution is not symmetrical. It is skewed towards the lower overlap ratios, with a peak between 25% and 50%.
* There is a significant number of instances with low overlap ratios (0% and (0,25]% bins).
* The percentage of instances with 100% overlap is relatively low, but not negligible.
### Interpretation
The data suggests that the majority of the analyzed instances exhibit a moderate degree of overlap, specifically between 25% and 50%. This could represent a scenario where partial overlap is common, while complete or no overlap is less frequent. The skewness of the distribution indicates that the process generating these overlap ratios favors lower overlap values.
The context of what "overlap" refers to is missing, but the data could be applied to various fields such as image analysis (object detection overlap), genomic sequencing (sequence alignment overlap), or market research (customer base overlap). Without further information, it's difficult to draw more specific conclusions. The data suggests that the overlap is not random, and there is a tendency towards partial overlap.