## Bar Chart: Distribution of Overlap Ratios
### Overview
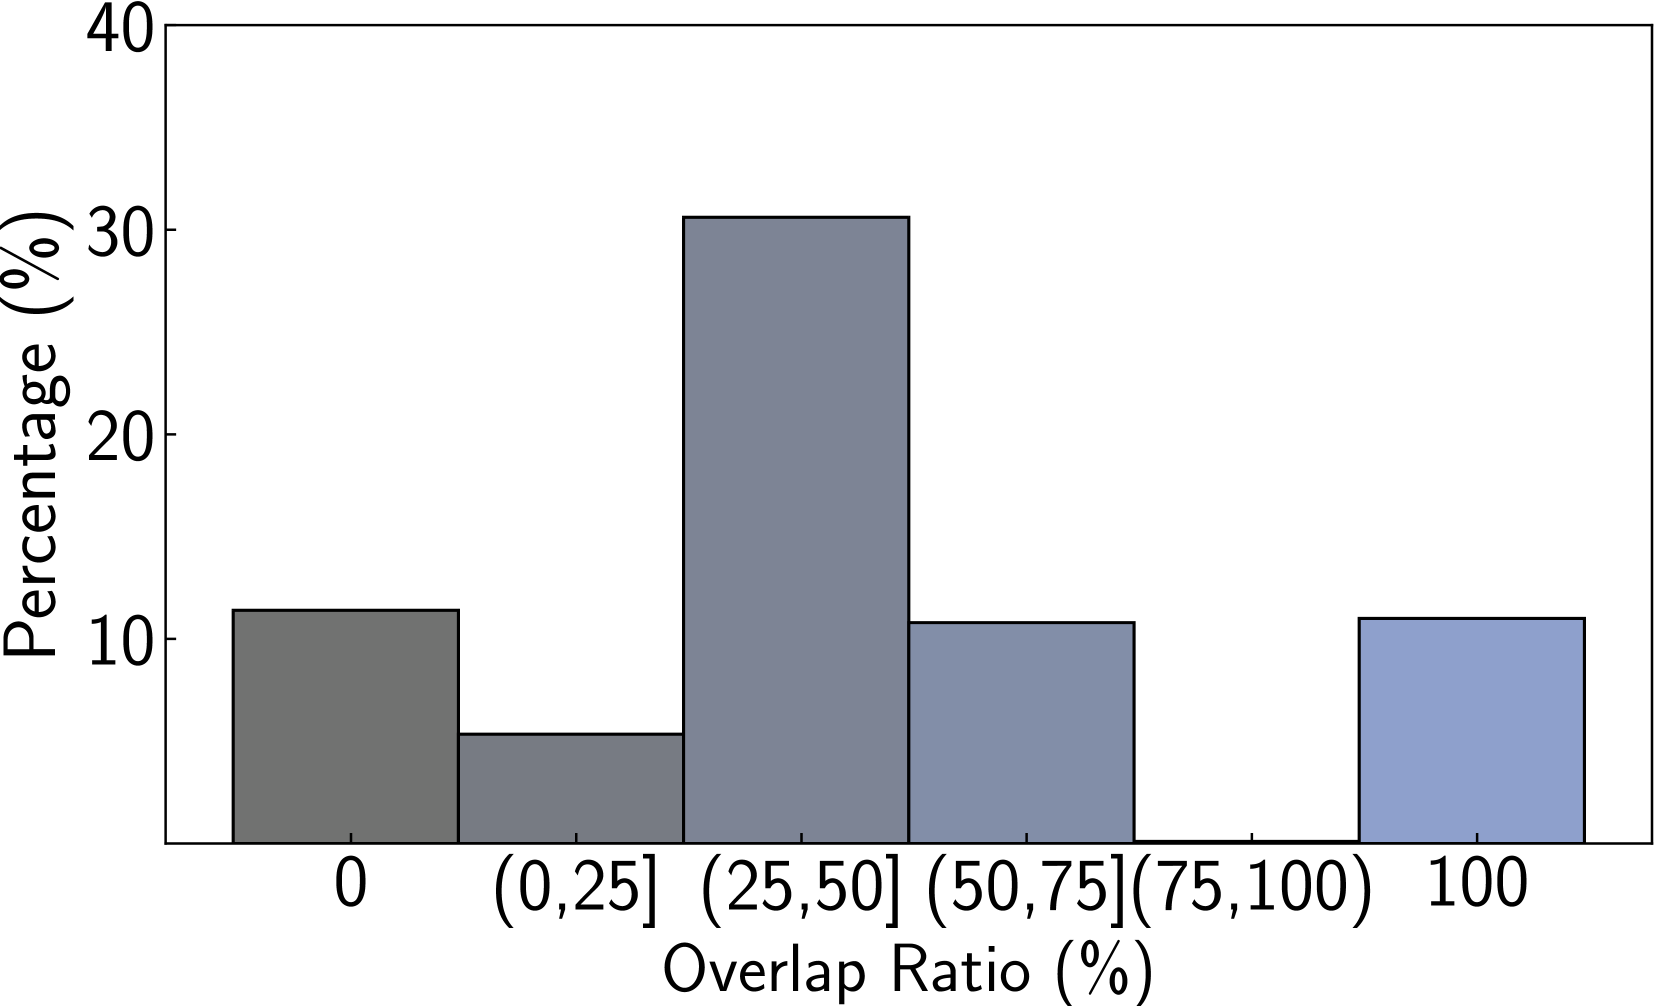
The chart displays two vertical bars representing the percentage distribution of overlap ratios. The x-axis categorizes overlap ratios into discrete ranges, while the y-axis shows the corresponding percentage values. Two distinct bars are present: one for "0" overlap ratio and another for "100" overlap ratio, both at 10% frequency.
### Components/Axes
- **X-axis (Overlap Ratio (%))**:
- Categories:
- `0` (dark gray bar)
- `(0,25]` (dark gray bar)
- `(25,50]` (dark gray bar)
- `(50,75]` (dark gray bar)
- `(75,100]` (dark gray bar)
- `100` (light blue bar)
- Labels: Overlap Ratio (%)
- **Y-axis (Percentage (%))**:
- Scale: 0–40% in 10% increments
- Labels: Percentage (%)
- **Legend**:
- Position: Right side of the chart
- Entries:
- Dark gray: Represents "0" and range categories
- Light blue: Represents "100" overlap ratio
### Detailed Analysis
- **Bar 1 (Dark Gray, "0" overlap ratio)**:
- Height: 10% on the y-axis
- Position: Leftmost bar
- **Bar 2 (Light Blue, "100" overlap ratio)**:
- Height: 10% on the y-axis
- Position: Rightmost bar
- **Intermediate Ranges**:
- All other overlap ratio ranges (`(0,25]`, `(25,50]`, `(50,75]`, `(75,100]`) have no visible bars, implying 0% frequency for these categories.
### Key Observations
1. **Equal Frequencies**: Both "0" and "100" overlap ratios account for 10% of the total distribution.
2. **Missing Data**: No bars exist for intermediate overlap ranges, suggesting these categories have no occurrences.
3. **Color Consistency**: The legend correctly maps dark gray to "0" and light blue to "100," with no mismatches.
### Interpretation
The chart suggests a bimodal distribution where only the extreme overlap ratios ("0" and "100") occur, each with equal frequency. The absence of intermediate ranges implies that most data points fall exclusively at these two extremes. This could indicate a binary classification system or a scenario where overlap is either nonexistent or complete. The equal percentages for "0" and "100" might reflect a balanced distribution between non-overlapping and fully overlapping cases, though the lack of intermediate data limits deeper analysis of trends or relationships.