# Technical Document Extraction: Heatmap Analysis
## Overview
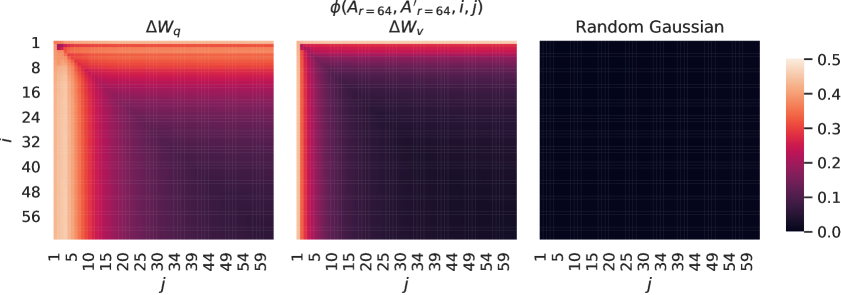
The image contains three heatmaps and a shared colorbar, analyzing variations in two metrics (`ΔW_q` and `φ(A_r=64, A'_r=64, i,j)`) across a grid of indices `i` and `j`. The third heatmap represents a "Random Gaussian" baseline. All heatmaps share identical axis ranges and a colorbar for value interpretation.
---
## Heatmap 1: `ΔW_q`
- **Title**: `ΔW_q`
- **X-axis**: `j` (horizontal), values: `1, 5, 10, 15, 20, 25, 30, 34, 39, 44, 49, 54, 59`
- **Y-axis**: `i` (vertical), values: `1, 8, 16, 24, 32, 40, 48, 56`
- **Color Gradient**:
- Top-left corner (i=1, j=1): Bright yellow (highest value, ~0.5 on colorbar).
- Gradual transition to dark purple (lowest value, ~0.0) toward the bottom-right.
- **Key Observations**:
- Values decrease monotonically from top-left to bottom-right.
- No significant local maxima or minima; uniform gradient.
---
## Heatmap 2: `φ(A_r=64, A'_r=64, i,j)`
- **Title**: `φ(A_r=64, A'_r=64, i,j)`
- **X-axis**: `j` (same as Heatmap 1).
- **Y-axis**: `i` (same as Heatmap 1).
- **Color Gradient**:
- Top-left corner (i=1, j=1): Orange (moderate value, ~0.3–0.4 on colorbar).
- Gradual transition to dark purple (low values, ~0.0) toward the bottom-right.
- **Key Observations**:
- Similar monotonic decrease as Heatmap 1 but with lower peak values.
- Slightly more pronounced gradient in the upper-left region.
---
## Heatmap 3: "Random Gaussian"
- **Title**: "Random Gaussian"
- **X-axis**: `j` (same as Heatmap 1).
- **Y-axis**: `i` (same as Heatmap 1).
- **Color Gradient**:
- Entire heatmap is uniformly dark purple (values near 0.0 on colorbar).
- **Key Observations**:
- No discernible pattern; values are consistently minimal across all `i` and `j`.
---
## Colorbar
- **Label**: Not explicitly labeled, but values range from `0.0` (dark purple) to `0.5` (bright yellow).
- **Placement**: Right-aligned, spanning all three heatmaps.
- **Scale**: Linear gradient from dark purple (0.0) to bright yellow (0.5).
---
## Cross-Referenced Analysis
1. **Legend Consistency**:
- Colorbar values align with heatmap gradients:
- Heatmap 1: Bright yellow (0.5) → dark purple (0.0).
- Heatmap 2: Orange (0.3–0.4) → dark purple (0.0).
- Heatmap 3: Uniform dark purple (0.0).
2. **Axis Alignment**:
- All heatmaps share identical axis ranges (`i: 1–56`, `j: 1–59`), ensuring direct comparability.
---
## Summary
- **Heatmap 1** (`ΔW_q`) shows the highest variability, with values peaking at the top-left.
- **Heatmap 2** (`φ`) exhibits lower peak values but a similar spatial trend.
- **Heatmap 3** ("Random Gaussian") serves as a baseline, with negligible values across the grid.
- All visualizations use a shared colorbar for consistent interpretation.