\n
## Technical Document Screenshot: Language Model Answer Evaluation Example
### Overview
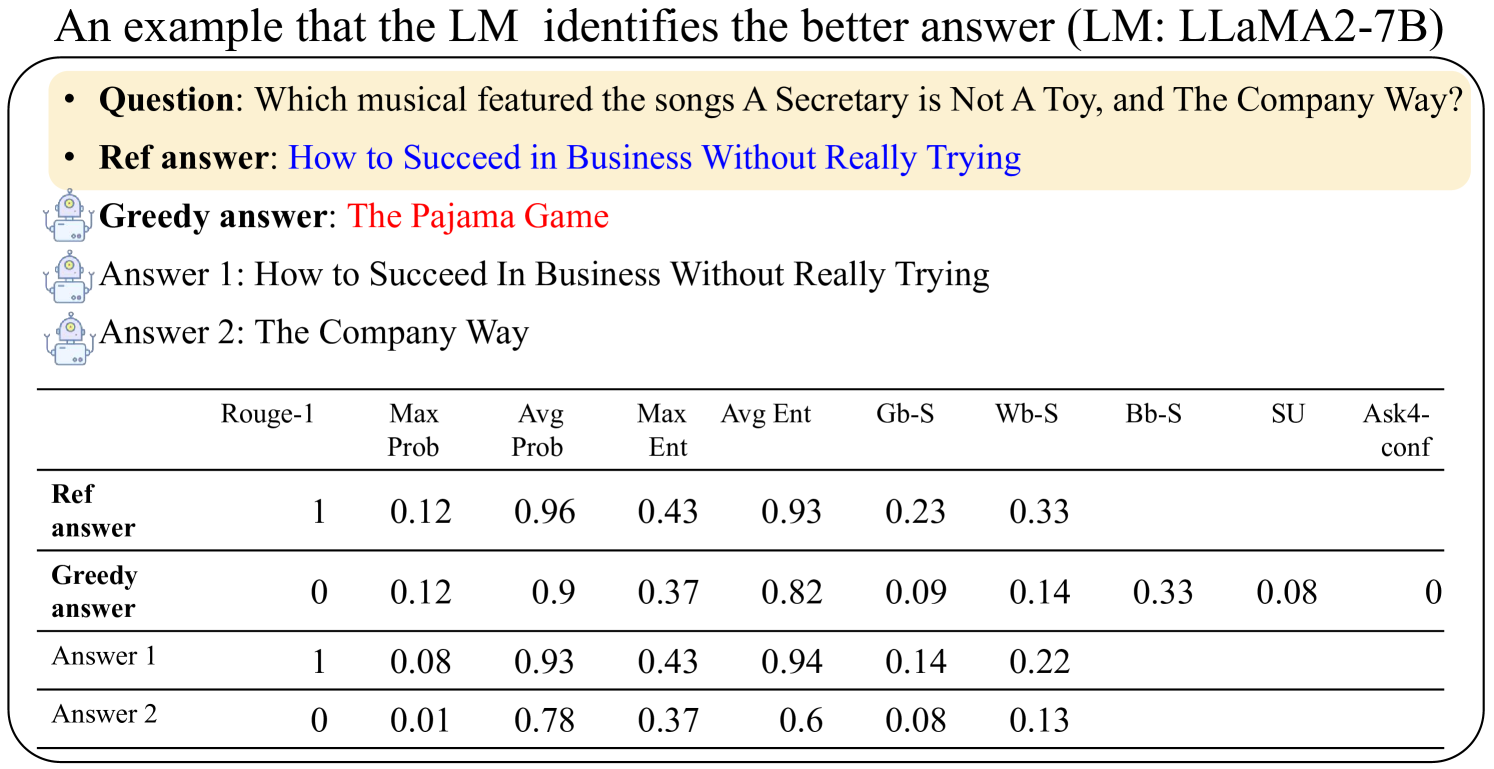
This image is a screenshot from a technical document or research paper. It presents an example of how a Language Model (LM), specifically LLaMA2-7B, evaluates different answers to a factual question. The image consists of two main parts: a textual example of a question and multiple candidate answers, followed by a data table comparing various evaluation metrics for those answers.
### Components/Axes
The image is structured into two primary regions:
1. **Header/Example Region (Top):** Contains the title and a question-answer example.
2. **Data Table Region (Bottom):** A table with numerical metrics.
**Header/Example Region Details:**
* **Title:** "An example that the LM identifies the better answer (LM: LLaMA2-7B)"
* **Question:** "Which musical featured the songs A Secretary is Not A Toy, and The Company Way?"
* **Reference Answer (Ref answer):** "How to Succeed in Business Without Really Trying" (displayed in blue text).
* **Greedy Answer:** "The Pajama Game" (displayed in red text).
* **Answer 1:** "How to Succeed In Business Without Really Trying"
* **Answer 2:** "The Company Way"
* **Icons:** Small robot icons are placed next to "Greedy answer", "Answer 1", and "Answer 2".
**Data Table Structure:**
The table has 10 columns and 4 data rows.
* **Column Headers (Metrics):**
1. Rouge-1
2. Max Prob
3. Avg Prob
4. Max Ent
5. Avg Ent
6. Gb-S
7. Wb-S
8. Bb-S
9. SU
10. Ask4-conf
* **Row Labels (Answer Types):**
1. Ref answer
2. Greedy answer
3. Answer 1
4. Answer 2
### Detailed Analysis / Content Details
**Transcription of the Question & Answer Example:**
* **Question:** Which musical featured the songs A Secretary is Not A Toy, and The Company Way?
* **Ref answer:** How to Succeed in Business Without Really Trying
* **Greedy answer:** The Pajama Game
* **Answer 1:** How to Succeed In Business Without Really Trying
* **Answer 2:** The Company Way
**Data Table Reconstruction:**
The following table lists the exact numerical values as they appear in the image. Empty cells indicate no data was provided for that metric-answer combination.
| Answer Type | Rouge-1 | Max Prob | Avg Prob | Max Ent | Avg Ent | Gb-S | Wb-S | Bb-S | SU | Ask4-conf |
|---------------|---------|----------|----------|---------|---------|-------|-------|-------|-------|-----------|
| **Ref answer** | 1 | 0.12 | 0.96 | 0.43 | 0.93 | 0.23 | 0.33 | | | |
| **Greedy answer** | 0 | 0.12 | 0.9 | 0.37 | 0.82 | 0.09 | 0.14 | 0.33 | 0.08 | 0 |
| **Answer 1** | 1 | 0.08 | 0.93 | 0.43 | 0.94 | 0.14 | 0.22 | | | |
| **Answer 2** | 0 | 0.01 | 0.78 | 0.37 | 0.6 | 0.08 | 0.13 | | | |
### Key Observations
1. **Answer Correctness:** The "Ref answer" and "Answer 1" are factually correct (the musical is *How to Succeed in Business Without Really Trying*). The "Greedy answer" (*The Pajama Game*) is incorrect. "Answer 2" (*The Company Way*) is a song title from the correct musical, not the musical itself.
2. **Metric Correlation with Correctness:**
* **Rouge-1:** Correct answers (Ref, Answer 1) score 1. Incorrect answers (Greedy, Answer 2) score 0.
* **Probability Metrics (Max/Avg Prob):** The correct "Ref answer" has the highest Avg Prob (0.96). The incorrect "Greedy answer" has a relatively high Max Prob (0.12, tied with Ref) but lower Avg Prob (0.9). "Answer 2" has the lowest probabilities.
* **Entropy Metrics (Max/Avg Ent):** Correct answers have higher entropy values (0.43/0.93-0.94) compared to incorrect ones (0.37/0.6-0.82), suggesting the model is less certain about incorrect outputs.
* **Specialized Scores (Gb-S, Wb-S, etc.):** The "Ref answer" scores highest on Gb-S (0.23) and Wb-S (0.33). The "Greedy answer" has unique, non-zero values for Bb-S (0.33), SU (0.08), and Ask4-conf (0), which are absent for other answers.
3. **Data Completeness:** The metrics Bb-S, SU, and Ask4-conf are only reported for the "Greedy answer".
### Interpretation
This image serves as a qualitative example to illustrate how a language model's internal metrics can be used to distinguish between better and worse answers, even when the model itself might generate an incorrect answer via greedy decoding.
* **What it demonstrates:** The table shows that the "better" answers (Ref and Answer 1) are characterized by high **Rouge-1** (lexical overlap with a ground truth), high **average probability** (the model assigns high likelihood to the sequence), and high **entropy** (indicating the model's confidence is distributed, not peaked on a single wrong token). The incorrect "Greedy answer" fails on Rouge-1 and has lower average probability and entropy.
* **Relationship between elements:** The example sets up a clear contrast. The textual part shows the *output* (answers), while the table quantifies the model's *internal state* when generating those outputs. It argues that metrics like Avg Prob and Avg Ent can serve as proxies for answer quality, potentially for reranking or filtering generated text.
* **Notable Anomalies/Insights:** The most striking insight is that the model's greedy search (which picks the most likely next token at each step) produced an incorrect answer ("The Pajama Game"), while other sampled answers (Answer 1) were correct. This highlights a known limitation of greedy decoding. Furthermore, the specialized scores (Gb-S, Wb-S, Bb-S, SU, Ask4-conf) appear to be diagnostic tools that provide different signals for different answer types, with the "Greedy answer" triggering unique values in the last three columns. This suggests these metrics might be designed to detect specific failure modes or characteristics of generated text.