## Scatter Plot: Performance vs. Arithmetic Intensity
### Overview
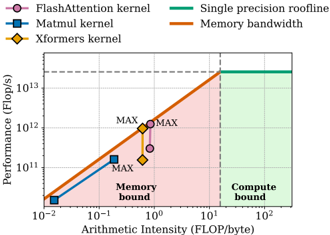
The chart visualizes the performance (in FLOP/s) of different computational kernels (FlashAttention, Matmul, Xformers) across varying arithmetic intensity (FLOP/byte). It includes two reference lines (Single precision roofline and Memory bandwidth) and shaded regions indicating computational bounds (Memory bound and Compute bound). The plot uses logarithmic scales for both axes.
### Components/Axes
- **Y-axis**: Performance (Flop/s) on a logarithmic scale (10¹¹ to 10¹³).
- **X-axis**: Arithmetic Intensity (FLOP/byte) on a logarithmic scale (10⁻² to 10²).
- **Legend**:
- **FlashAttention kernel**: Pink circle (⚫).
- **Matmul kernel**: Blue square (🟦).
- **Xformers kernel**: Yellow diamond (🟨).
- **Single precision roofline**: Green line (🟩).
- **Memory bandwidth**: Orange line (🟧).
- **Shaded Regions**:
- **Memory bound**: Pink area (🟥).
- **Compute bound**: Green area (🟩).
### Detailed Analysis
1. **Data Series**:
- **FlashAttention kernel**:
- MAX point at (10⁰ FLOP/byte, 10¹² Flop/s).
- Performance increases with arithmetic intensity, peaking at the Memory bound.
- **Matmul kernel**:
- MAX point at (10⁻¹ FLOP/byte, 10¹¹ Flop/s).
- Performance rises steeply but plateaus near the Memory bound.
- **Xformers kernel**:
- MAX point at (10⁰ FLOP/byte, 10¹² Flop/s).
- Similar trend to FlashAttention, peaking at the Memory bound.
- **Single precision roofline**: Horizontal line at 10¹³ Flop/s, representing the theoretical maximum performance.
- **Memory bandwidth**: Diagonal line from (10⁻² FLOP/byte, 10¹¹ Flop/s) to (10¹ FLOP/byte, 10¹³ Flop/s), indicating the upper limit of memory-constrained performance.
2. **Shaded Regions**:
- **Memory bound**: Below the Memory bandwidth line, where performance is limited by memory access.
- **Compute bound**: Above the Memory bandwidth line, where performance is limited by computational resources.
### Key Observations
- All kernels (FlashAttention, Matmul, Xformers) achieve their maximum performance within the **Memory bound** region.
- The **Single precision roofline** (10¹³ Flop/s) is the highest performance threshold, but no kernel reaches it.
- The **Memory bandwidth** line acts as a boundary between Memory-bound and Compute-bound regions.
- The **Compute bound** region (green) is unoccupied by any kernel, suggesting no kernel operates in this regime.
### Interpretation
The chart demonstrates that memory bandwidth is a critical bottleneck for these kernels. All kernels are optimized to maximize performance within the Memory-bound region, but none approach the theoretical roofline. This implies that improving memory bandwidth or optimizing for higher arithmetic intensity could unlock greater performance. The absence of data in the Compute-bound region suggests that current implementations prioritize memory efficiency over raw computational throughput. The shaded regions provide a clear visual distinction between memory and compute constraints, highlighting the trade-offs in system design.