## Clinical Reasoning Diagram: Heart Failure Diagnosis
### Overview
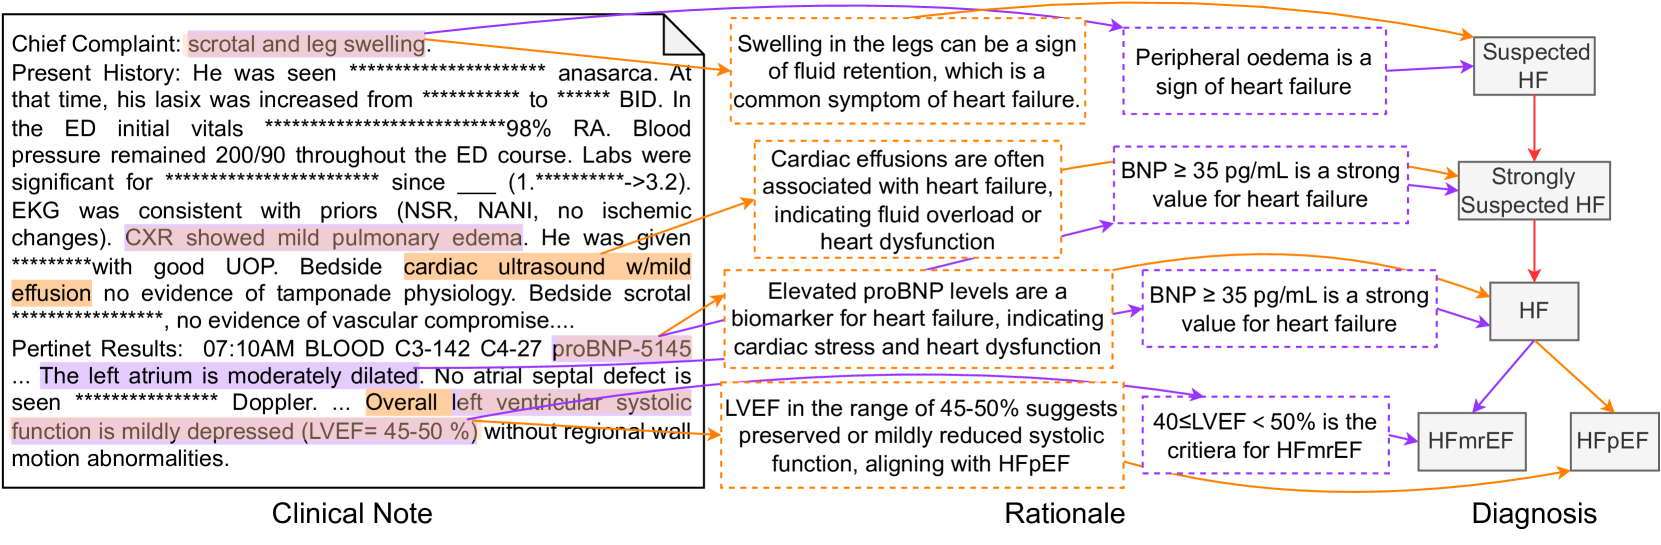
This image presents a diagram illustrating the clinical reasoning process for diagnosing heart failure (HF). It connects clinical observations from a patient's case (Clinical Note) to the rationale behind diagnostic decisions, ultimately leading to a diagnosis (Diagnosis). The diagram uses arrows to show the flow of information and relationships between different findings and conclusions.
### Components/Axes
The diagram is divided into three main sections, arranged horizontally:
1. **Clinical Note:** This section contains excerpts from a patient's medical record, including chief complaints, present history, and pertinent results.
2. **Rationale:** This section provides the medical reasoning and explanations that link the clinical findings to potential diagnoses.
3. **Diagnosis:** This section presents the possible diagnoses based on the clinical findings and rationale.
The diagram uses two colors of arrows to connect the sections:
* **Orange Arrows:** Connect clinical findings to the rationale.
* **Purple Arrows:** Connect the rationale to the diagnosis.
### Detailed Analysis or ### Content Details
**1. Clinical Note (Left Section):**
* **Chief Complaint:** scrotal and leg swelling.
* **Present History:** He was seen *************************** anasarca. At that time, his lasix was increased from *********** to ****** BID. In the ED initial vitals ***************************98% RA. Blood pressure remained 200/90 throughout the ED course. Labs were significant for ********** since \_\_\_ (1.**********->3.2). EKG was consistent with priors (NSR, NANI, no ischemic changes). CXR showed mild pulmonary edema. He was given **********with good UOP. Bedside cardiac ultrasound w/mild effusion no evidence of tamponade physiology. Bedside scrotal **********, no evidence of vascular compromise....
* **Pertinent Results:** 07:10AM BLOOD C3-142 C4-27 proBNP-5145
* The left atrium is moderately dilated. No atrial septal defect is seen **************** Doppler. Overall left ventricular systolic function is mildly depressed (LVEF= 45-50%) without regional wall motion abnormalities.
**2. Rationale (Middle Section):**
* Swelling in the legs can be a sign of fluid retention, which is a common symptom of heart failure.
* Cardiac effusions are often associated with heart failure, indicating fluid overload or heart dysfunction.
* Elevated proBNP levels are a biomarker for heart failure, indicating cardiac stress and heart dysfunction.
* LVEF in the range of 45-50% suggests preserved or mildly reduced systolic function, aligning with HFpEF.
**3. Diagnosis (Right Section):**
* Peripheral oedema is a sign of heart failure -> Suspected HF
* BNP ≥ 35 pg/mL is a strong value for heart failure -> Strongly Suspected HF
* BNP ≥ 35 pg/mL is a strong value for heart failure -> HF
* 40≤LVEF < 50% is the criteria for HFmrEF -> HFmrEF
* LVEF in the range of 45-50% suggests preserved or mildly reduced systolic function, aligning with HFpEF -> HFpEF
### Key Observations
* The diagram connects specific clinical findings (e.g., leg swelling, pulmonary edema, LVEF range) to the rationale behind considering heart failure.
* Elevated proBNP levels are used as a biomarker for heart failure. The proBNP value is 5145.
* The diagram shows how different LVEF ranges can lead to different types of heart failure diagnoses (HFmrEF, HFpEF).
### Interpretation
The diagram illustrates a simplified clinical reasoning process for diagnosing heart failure. It demonstrates how specific clinical findings, combined with medical knowledge and diagnostic criteria, can lead to a diagnosis of heart failure and its subtypes. The diagram highlights the importance of considering multiple factors, such as symptoms, lab results, and echocardiographic findings, in the diagnostic process. The diagram also shows how the same clinical finding (e.g., BNP ≥ 35 pg/mL) can lead to different levels of diagnostic certainty (e.g., "Strongly Suspected HF" vs. "HF").