\n
## Diagram: Dependency Graph
### Overview
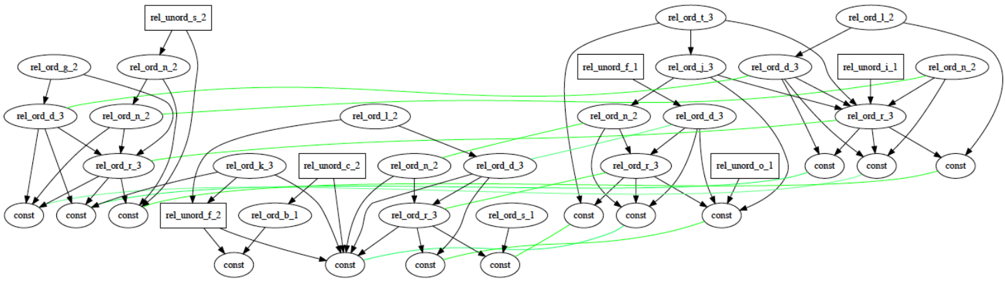
The image depicts a directed acyclic graph (DAG) representing dependencies between various components. The nodes are labeled with strings like "rel_ord_x_y" and "const", and the relationships are shown with directed edges (arrows). The graph is split into two main sections, with connections between them. The diagram appears to represent a computational or logical flow.
### Components/Axes
There are no axes in this diagram. The components are nodes labeled with strings. The edges represent dependencies. The nodes can be categorized as follows:
* **rel_ord_x_y:** Nodes labeled with "rel_ord" followed by two underscores and two numbers (e.g., rel_ord_n_2, rel_ord_d_3).
* **rel_mord_x_y:** Nodes labeled with "rel_mord" followed by two underscores and two numbers (e.g., rel_mord_f_1, rel_mord_o_1).
* **rel_mord_k_3:** A single node labeled "rel_mord_k_3".
* **const:** Nodes labeled simply as "const".
### Detailed Analysis or Content Details
**Left Section:**
* `rel_umord_i_2` points to `rel_ord_n_2`.
* `rel_ord_n_2` points to `rel_ord_d_3`.
* `rel_ord_d_3` points to `rel_ord_n_3`.
* `rel_ord_n_3` points to `const` (twice).
* `rel_umord_f_2` points to `rel_ord_k_3`.
* `rel_ord_k_3` points to `rel_mord_k_3`.
* `rel_mord_k_3` points to `rel_ord_n_2`.
* `rel_mord_k_3` points to `rel_ord_d_3`.
* `rel_ord_d_3` points to `rel_ord_j_1`.
* `rel_ord_j_1` points to `const` (three times).
**Right Section:**
* `rel_ord_i_1` points to `rel_mord_f_1`.
* `rel_mord_f_1` points to `rel_ord_d_3`.
* `rel_ord_d_3` points to `rel_ord_n_2`.
* `rel_ord_n_2` points to `rel_ord_r_3`.
* `rel_ord_r_3` points to `const` (twice).
* `rel_mord_o_1` points to `const` (twice).
* `rel_ord_j_1` points to `rel_mord_o_1`.
**Connections between Sections:**
* `rel_ord_d_3` (left section) points to `rel_ord_d_3` (right section).
* `rel_ord_n_2` (left section) points to `rel_ord_n_2` (right section).
**Edge Colors:**
* Most edges are black.
* Edges connecting `rel_mord_k_3` to `rel_ord_n_2` and `rel_ord_d_3` are green.
* The edge connecting `rel_ord_d_3` (left) to `rel_ord_d_3` (right) is orange.
* The edge connecting `rel_ord_n_2` (left) to `rel_ord_n_2` (right) is teal.
### Key Observations
The diagram shows a complex network of dependencies. The "const" nodes appear to be terminal nodes, representing the end of a computation or logical path. The "rel_ord" and "rel_mord" nodes likely represent intermediate steps or operations. The green edges highlight specific dependencies involving `rel_mord_k_3`, suggesting it might be a critical component. The orange and teal edges indicate cross-section dependencies.
### Interpretation
This diagram likely represents a computational pipeline or a logical dependency graph. The nodes represent operations or data transformations, and the edges represent the flow of data or control. The "const" nodes could represent constant values or final results. The two sections might represent different modules or stages of the pipeline. The colored edges could indicate different types of dependencies or data flows.
The presence of multiple paths to the "const" nodes suggests redundancy or alternative computation paths. The connections between the two sections indicate that the modules are not entirely independent and share some dependencies. The diagram could be used for optimization, debugging, or understanding the overall structure of the system. The naming convention of the nodes ("rel_ord", "rel_mord") suggests they relate to some kind of ordering or modification operation. Without further context, it's difficult to determine the specific meaning of these operations.