## Flowchart Diagram: Relational Order and Unorder Nodes
### Overview
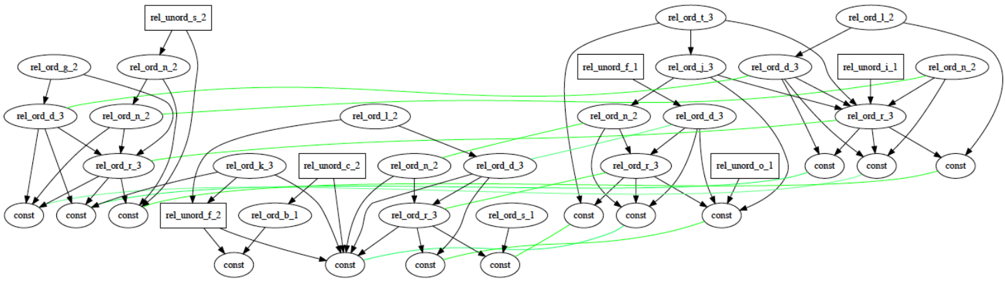
The image depicts a complex flowchart diagram with interconnected nodes and directional arrows. The diagram appears to represent a system of relational orders and unorders, with nodes labeled using a consistent naming convention (e.g., `rel_ord_`, `rel_unord_`, `const`). Arrows indicate directional relationships between nodes, with some arrows highlighted in green. The structure suggests a hierarchical or networked system with multiple layers of connections.
---
### Components/Axes
- **Nodes**:
- Labeled with identifiers such as `rel_ord_g_2`, `rel_unord_s_2`, `rel_ord_n_2`, `rel_ord_d_3`, `rel_ord_r_3`, `rel_unord_c_2`, `rel_unord_f_1`, `rel_unord_i_1`, and `const`.
- Nodes are grouped into clusters (e.g., left, central, right sections).
- **Arrows**:
- Black arrows represent primary directional relationships.
- Green arrows indicate secondary or alternative pathways (e.g., loops or feedback connections).
- **No explicit legend** is visible, but color coding (green vs. black) may imply different relationship types.
---
### Detailed Analysis
#### Node Labels and Connections
1. **Left Section**:
- Nodes: `rel_ord_g_2`, `rel_ord_n_2`, `rel_ord_d_3`, `rel_ord_r_3`, `rel_unord_s_2`, `rel_unord_c_2`, `rel_unord_f_2`, `rel_unord_b_1`.
- Connections:
- `rel_ord_g_2` → `rel_unord_s_2` (black arrow).
- `rel_ord_n_2` → `rel_unord_c_2` (black arrow).
- `rel_ord_d_3` → `rel_unord_f_2` (black arrow).
- `rel_ord_r_3` → `rel_unord_b_1` (black arrow).
- Green arrows form loops between `rel_ord_g_2`, `rel_ord_n_2`, and `rel_ord_d_3`.
2. **Central Section**:
- Nodes: `rel_ord_l_2`, `rel_ord_k_3`, `rel_ord_b_1`, `rel_ord_s_1`, `rel_ord_j_3`, `rel_ord_t_3`, `rel_ord_i_1`, `rel_ord_n_2`, `rel_ord_d_3`, `rel_ord_r_3`.
- Connections:
- `rel_ord_l_2` → `rel_unord_c_2` (black arrow).
- `rel_ord_k_3` → `rel_unord_f_1` (black arrow).
- `rel_ord_j_3` → `rel_unord_i_1` (black arrow).
- Green arrows connect `rel_ord_l_2` to `rel_ord_k_3` and `rel_ord_j_3`.
3. **Right Section**:
- Nodes: `rel_ord_l_2`, `rel_ord_j_3`, `rel_ord_t_3`, `rel_ord_i_1`, `rel_ord_n_2`, `rel_ord_d_3`, `rel_ord_r_3`, `rel_unord_o_1`.
- Connections:
- `rel_ord_l_2` → `rel_unord_o_1` (black arrow).
- `rel_ord_j_3` → `rel_unord_o_1` (black arrow).
- `rel_ord_t_3` → `rel_unord_o_1` (black arrow).
- Green arrows link `rel_ord_l_2` to `rel_ord_j_3` and `rel_ord_t_3`.
#### "const" Nodes
- Multiple nodes labeled `const` are present, likely representing fixed or constant values. These are connected to other nodes via black arrows, suggesting they are inputs or reference points.
---
### Key Observations
1. **Hierarchical Structure**:
- The diagram is divided into three main sections (left, central, right), each with distinct node clusters.
- The central section acts as a hub, connecting multiple nodes from the left and right sections.
2. **Repetition of Labels**:
- Labels like `rel_ord_n_2`, `rel_ord_d_3`, and `rel_ord_r_3` appear in multiple sections, indicating shared or overlapping relationships.
3. **Green Arrows**:
- Green arrows form loops and alternative pathways, suggesting feedback mechanisms or redundant connections.
4. **Absence of Numerical Data**:
- No numerical values, scales, or quantitative data are present. The diagram focuses on structural relationships.
---
### Interpretation
- **Purpose**: The diagram likely represents a workflow, dependency graph, or relational system where nodes symbolize entities (e.g., processes, variables) and arrows denote interactions or dependencies.
- **Key Relationships**:
- The central node `rel_unord_c_2` appears to be a critical junction, connecting multiple nodes from the left and right sections.
- The repeated use of `rel_ord_` and `rel_unord_` suggests a system where "order" and "unorder" states are dynamically managed.
- **Anomalies**:
- The green arrows introduce ambiguity, as their purpose (e.g., alternative paths, exceptions) is not explicitly defined.
- The lack of a legend or key limits the ability to interpret color-coded relationships definitively.
---
### Conclusion
This diagram illustrates a complex network of relational orders and unorders, with a focus on structural relationships rather than quantitative data. The use of `const` nodes and directional arrows suggests a system designed to model dependencies, feedback loops, or hierarchical processes. Further clarification on the meaning of green arrows and node labels would enhance interpretability.