## Heatmap with Histogram Panels: Bit Position Frequency Analysis
### Overview
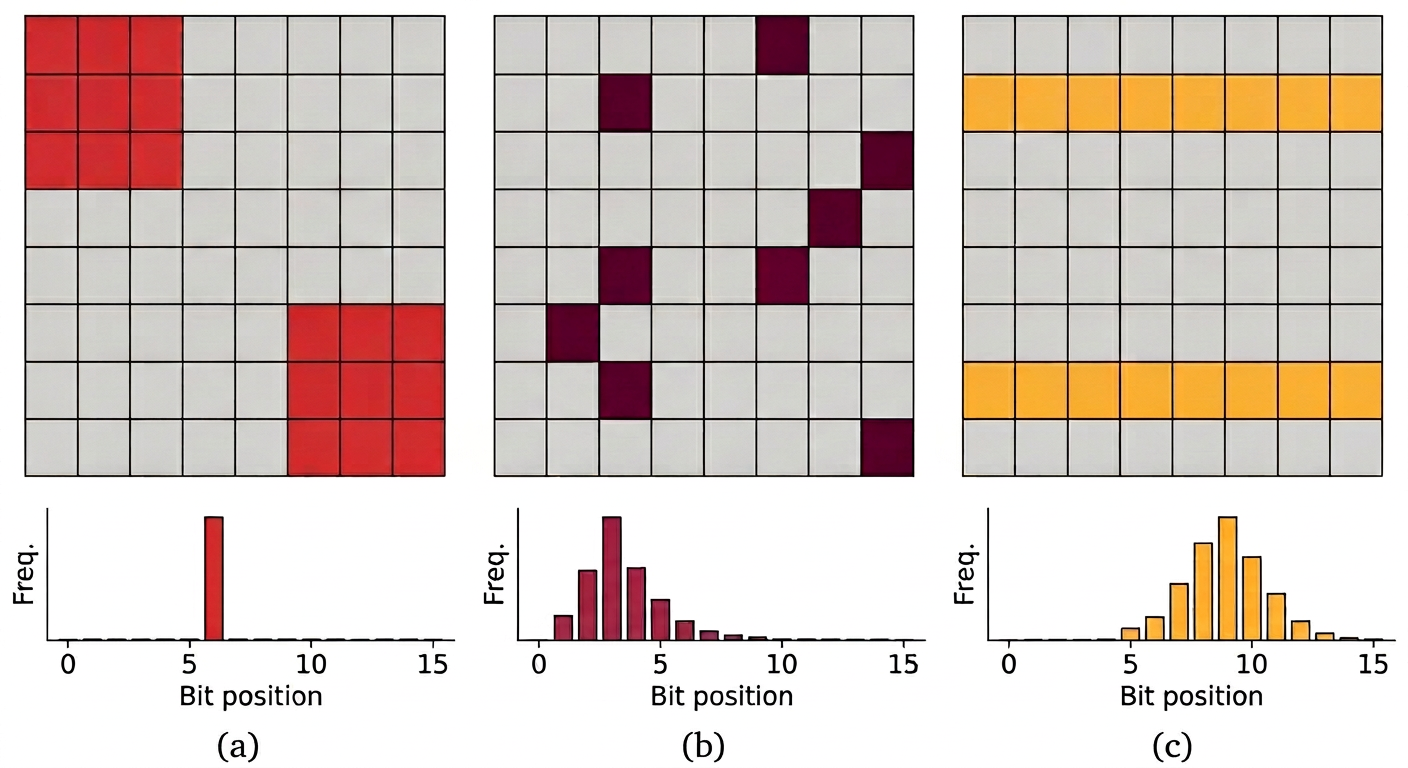
The image consists of three panels (a, b, c), each containing a 16x16 grid with colored squares and a corresponding histogram below. The grids visualize spatial distributions of colored squares, while the histograms quantify frequency distributions across bit positions (0-15). Colors (red, maroon, yellow) represent distinct data categories.
### Components/Axes
- **Grids**:
- 16x16 matrix with black grid lines
- Colored squares (red, maroon, yellow) in specific positions
- **Histograms**:
- X-axis: "Bit position" (0-15)
- Y-axis: "Freq." (frequency)
- Bar colors match grid colors (red, maroon, yellow)
- **Legends**: Implied by color coding (no explicit legend visible)
### Detailed Analysis
#### Panel (a)
- **Grid**:
- Red squares occupy:
- Top-left 4x4 quadrant (rows 0-3, columns 0-3)
- Bottom-right 2x2 quadrant (rows 14-15, columns 14-15)
- **Histogram**:
- Single red bar at bit position 5
- Frequency ≈ 12 (estimated from bar height)
- **Spatial Correlation**: Red squares in grid align with bit position 5 in histogram
#### Panel (b)
- **Grid**:
- Maroon squares distributed across:
- Diagonal from top-right to bottom-left
- Scattered in middle rows (rows 4-10)
- **Histogram**:
- Multiple maroon bars at:
- Bit 3: ≈ 8
- Bit 5: ≈ 6
- Bit 7: ≈ 5
- Bit 9: ≈ 4
- Bit 11: ≈ 3
- Bit 13: ≈ 2
- Bit 15: ≈ 1
- **Spatial Correlation**: Maroon squares map to odd-numbered bit positions
#### Panel (c)
- **Grid**:
- Yellow squares form:
- Top row (row 0, columns 0-15)
- Bottom row (row 15, columns 0-15)
- **Histogram**:
- Bell-shaped distribution centered at bit 10
- Frequencies:
- Bit 10: ≈ 15
- Bit 9/11: ≈ 12
- Bit 8/12: ≈ 8
- Bit 7/13: ≈ 5
- Bit 6/14: ≈ 3
- Bit 5/15: ≈ 1
- **Spatial Correlation**: Yellow squares in top/bottom rows correspond to bit positions near 10
### Key Observations
1. **Panel (a)**: Single dominant bit (5) with clustered spatial representation
2. **Panel (b)**: Multiple bits with decreasing frequency (3 > 5 > 7 > ... > 15)
3. **Panel (c)**: Symmetric normal distribution centered at bit 10
4. **Color Consistency**: All histograms use matching colors to their respective grids
5. **Bit Position Mapping**: Grid coordinates correlate with bit positions via:
- Row = Bit position (0-15)
- Column = Bit value (0-15)
### Interpretation
The data demonstrates three distinct bit distribution patterns:
1. **Localized Activation** (Panel a): Single bit (5) dominates with spatial clustering
2. **Sparse Distribution** (Panel b): Odd-numbered bits show decreasing frequency, suggesting structured encoding
3. **Normal Distribution** (Panel c): Symmetric spread around bit 10 indicates random or Gaussian-like bit allocation
The histograms validate the spatial patterns in grids, confirming that:
- Panel (a) represents a 1-bit system with positional encoding
- Panel (b) shows a multi-bit system with priority ordering (lower bit positions more frequent)
- Panel (c) demonstrates a balanced bit distribution with central tendency
Notable anomalies include the perfect symmetry in Panel (c) and the strict odd-bit pattern in Panel (b), suggesting intentional design rather than random distribution.