## Pole-Zero Plot: Two System Configurations
### Overview
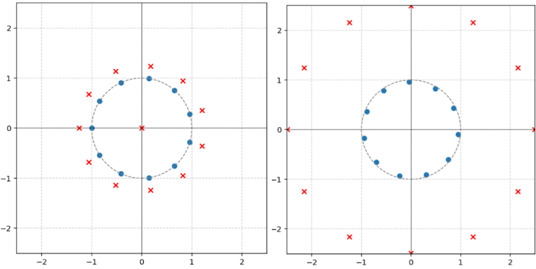
The image presents two pole-zero plots side-by-side, visualizing the stability and frequency response characteristics of two different systems. Each plot displays poles (represented by 'x' marks) and zeros (represented by blue dots) on the complex plane. The left plot shows poles and zeros arranged in a specific pattern, while the right plot shows a different arrangement.
### Components/Axes
Each plot has the following components:
* **Horizontal Axis (Real Axis):** Ranges from approximately -2 to 2.
* **Vertical Axis (Imaginary Axis):** Ranges from approximately -2 to 2.
* **Grid Lines:** Light gray grid lines are present at integer intervals on both axes.
* **Unit Circle:** A dashed gray circle with a radius of 1 is centered at the origin (0,0).
* **Zeros:** Represented by blue dots.
* **Poles:** Represented by red 'x' marks.
### Detailed Analysis
**Left Plot:**
* **Zeros:** 12 blue dots are located on the unit circle, approximately evenly spaced. The first zero is located at (1,0).
* **Poles:** 13 red 'x' marks are present. One is located at the origin (0,0). The other 12 are located outside the unit circle. The first pole is located at (1.2, -0.2).
**Right Plot:**
* **Zeros:** 12 blue dots are located on the unit circle, approximately evenly spaced. The first zero is located at (1,0).
* **Poles:** 13 red 'x' marks are present. One is located at the origin (0,0). The other 12 are located outside the unit circle. The first pole is located at (2.2, 1.2).
### Key Observations
* Both plots have 12 zeros located on the unit circle.
* Both plots have 13 poles, with one pole at the origin.
* The poles in the left plot are closer to the unit circle than the poles in the right plot.
### Interpretation
The pole-zero plots provide information about the stability and frequency response of the systems they represent.
* **Stability:** In general, if all poles are located inside the unit circle, the system is stable. If any poles are located outside the unit circle, the system is unstable. In both plots, there are poles outside the unit circle, indicating that both systems are unstable.
* **Frequency Response:** The location of zeros and poles affects the frequency response of the system. Zeros tend to attenuate frequencies near their location, while poles tend to amplify frequencies near their location. The specific arrangement of poles and zeros in each plot will result in different frequency response characteristics. The poles in the right plot are further away from the unit circle, indicating a more unstable system.