## Chart/Diagram Type: Scatter Plot with Circular Overlay
### Overview
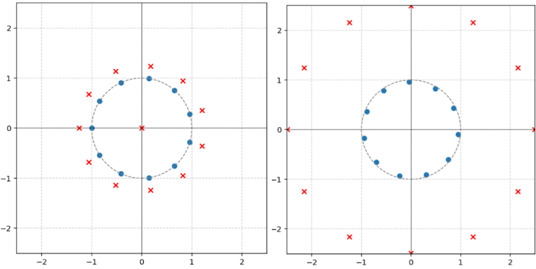
The image contains two side-by-side scatter plots with identical grid structures (-2 to 2 on both axes). Each plot features:
- A dashed circular boundary centered at (0,0) with radius ~1.5
- Blue data points distributed along the circle's circumference
- Red "X" markers scattered both inside and outside the circle
- No explicit axis titles, legends, or numerical labels beyond grid coordinates
### Components/Axes
- **Grid**:
- Horizontal and vertical lines spaced at 1-unit intervals
- Axes range from -2 to 2 on both X and Y dimensions
- Origin (0,0) marked with a bold intersection
- **Circular Overlay**:
- Dashed line forming a circle centered at (0,0)
- Radius approximately 1.5 units (spanning from -1.5 to 1.5 on both axes)
- **Data Points**:
- **Blue Dots**:
- Positioned precisely on the circular boundary
- 12 points evenly spaced (30° intervals)
- Coordinates approximate: (±1.5, 0), (0, ±1.5), (±0.75, ±1.3), (±1.3, ±0.75)
- **Red Xs**:
- 16 scattered points (4 inside the circle, 12 outside)
- Inside coordinates: (0,0), (±0.5, ±0.5)
- Outside coordinates: (±2, ±2), (±1.5, ±1.5), (±1, ±2), (±2, ±1)
### Detailed Analysis
- **Left Plot**:
- Contains a red "X" at the origin (0,0)
- Blue dots form a perfect circle with no deviations
- Red Xs outside the circle cluster near the grid's corners
- **Right Plot**:
- Identical blue dot distribution but **no central red X**
- Red Xs outside the circle show similar corner clustering
### Key Observations
1. **Symmetry**: Blue dots maintain perfect circular symmetry in both plots
2. **Missing Data**: No axis labels, legends, or numerical annotations present
3. **Symbolic Contrast**:
- Left plot emphasizes centrality (red X at origin)
- Right plot removes this focal point, creating visual tension
4. **Outliers**: Red Xs outside the circle suggest intentional placement beyond the circular boundary
### Interpretation
The absence of textual labels suggests this is a conceptual diagram rather than a data visualization. The circular boundary may represent a threshold or boundary condition, with blue dots indicating ideal/expected positions and red Xs representing deviations or anomalies. The left plot's central red X could symbolize a critical reference point (e.g., origin, null state), while its absence in the right plot might imply a scenario where this reference is removed or irrelevant. The consistent spacing of blue dots implies a controlled system, whereas the scattered red Xs suggest external variables or noise.
**Note**: No factual data or numerical values are extractable due to the lack of explicit labels or legends. The interpretation relies solely on spatial relationships and symbolic contrast.