## Chart/Diagram Type: Multi-Panel Performance Comparison
### Overview
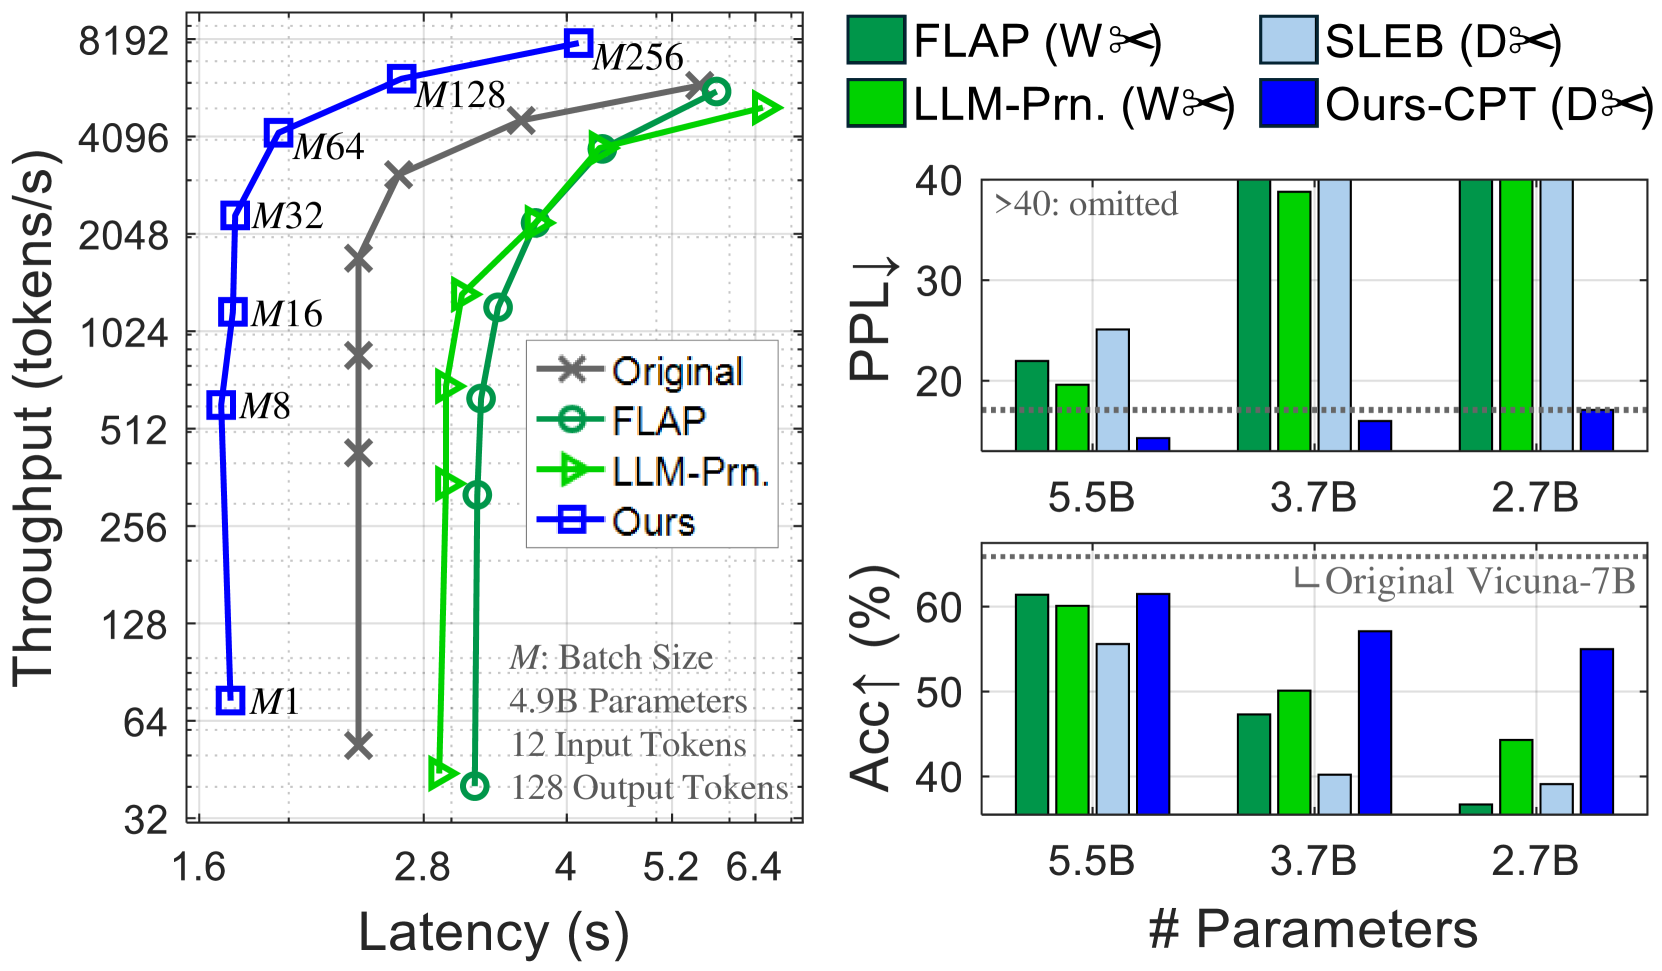
The image presents a multi-panel figure comparing the performance of different language models. The left panel shows a throughput vs. latency plot, while the right panels display perplexity (PPL) and accuracy (Acc) bar charts for varying model sizes. The models compared are "Original", "FLAP", "LLM-Prn.", "SLEB", and "Ours/Ours-CPT".
### Components/Axes
**Left Panel: Throughput vs. Latency**
* **X-axis:** Latency (s), ranging from 1.6 to 6.4.
* **Y-axis:** Throughput (tokens/s), ranging from 32 to 8192 (logarithmic scale).
* **Legend (Top-Right):**
* Original (Gray line with 'x' markers)
* FLAP (Green line with circle markers)
* LLM-Prn. (Green line with triangle markers)
* Ours (Blue line with square markers)
* **Annotations:**
* "M: Batch Size"
* "4.9B Parameters"
* "12 Input Tokens"
* "128 Output Tokens"
* Batch sizes are annotated near the "Ours" line: M1, M8, M16, M32, M64, M128, M256
**Right Panels: Perplexity and Accuracy Bar Charts**
* **X-axis (both charts):** # Parameters, with values 5.5B, 3.7B, and 2.7B.
* **Top Right Panel: Perplexity (PPL)**
* Y-axis: PPL↓, ranging from 20 to 40. Values above 40 are omitted and indicated by ">40: omitted".
* Legend (Top):
* FLAP (Dark Green)
* LLM-Prn. (Light Green)
* SLEB (Light Blue)
* Ours-CPT (Dark Blue)
* Horizontal dotted line at PPL = 17.5, without a label.
* **Bottom Right Panel: Accuracy (Acc)**
* Y-axis: Acc↑ (%), ranging from 40 to 60.
* Legend: "Original Vicuna-7B" (Horizontal dotted line at Acc = 58%)
* Bar colors match the Perplexity chart.
### Detailed Analysis
**Left Panel: Throughput vs. Latency**
* **Original (Gray 'x' markers):** Throughput increases with latency.
* (2.0s, 64 tokens/s)
* (2.4s, 128 tokens/s)
* (2.8s, 512 tokens/s)
* (3.2s, 1024 tokens/s)
* (4.0s, 2048 tokens/s)
* (5.2s, 4096 tokens/s)
* **FLAP (Green circle markers):** Throughput increases with latency.
* (3.2s, 256 tokens/s)
* (3.6s, 512 tokens/s)
* (4.0s, 1024 tokens/s)
* (4.8s, 2048 tokens/s)
* (5.6s, 4096 tokens/s)
* **LLM-Prn. (Green triangle markers):** Throughput increases with latency.
* (2.8s, 32 tokens/s)
* (3.2s, 512 tokens/s)
* (3.6s, 1024 tokens/s)
* (4.4s, 2048 tokens/s)
* (5.2s, 4096 tokens/s)
* **Ours (Blue square markers):** Throughput increases sharply with latency.
* (1.6s, 64 tokens/s)
* (1.6s, 512 tokens/s)
* (1.6s, 1024 tokens/s)
* (1.6s, 2048 tokens/s)
* (1.6s, 4096 tokens/s)
* (1.6s, 8192 tokens/s)
**Right Panels: Perplexity and Accuracy Bar Charts**
* **Perplexity (PPL) Chart:**
* **5.5B Parameters:**
* FLAP (Dark Green): ~22
* LLM-Prn. (Light Green): ~20
* SLEB (Light Blue): ~25
* Ours-CPT (Dark Blue): ~10
* **3.7B Parameters:**
* FLAP (Dark Green): >40
* LLM-Prn. (Light Green): >40
* SLEB (Light Blue): >40
* Ours-CPT (Dark Blue): ~2
* **2.7B Parameters:**
* FLAP (Dark Green): >40
* LLM-Prn. (Light Green): >40
* SLEB (Light Blue): >40
* Ours-CPT (Dark Blue): ~2
* **Accuracy (Acc) Chart:**
* **5.5B Parameters:**
* FLAP (Dark Green): ~60%
* LLM-Prn. (Light Green): ~60%
* SLEB (Light Blue): ~55%
* Ours-CPT (Dark Blue): ~62%
* **3.7B Parameters:**
* FLAP (Dark Green): ~50%
* LLM-Prn. (Light Green): ~50%
* SLEB (Light Blue): ~10%
* Ours-CPT (Dark Blue): ~62%
* **2.7B Parameters:**
* FLAP (Dark Green): ~10%
* LLM-Prn. (Light Green): ~45%
* SLEB (Light Blue): ~10%
* Ours-CPT (Dark Blue): ~62%
### Key Observations
* **Throughput vs. Latency:** The "Ours" model demonstrates significantly higher throughput at lower latencies compared to the other models.
* **Perplexity:** The "Ours-CPT" model consistently achieves the lowest perplexity across all parameter sizes. Perplexity for FLAP, LLM-Prn, and SLEB exceeds the chart limit for 3.7B and 2.7B parameters.
* **Accuracy:** The "Ours-CPT" model maintains high accuracy across all parameter sizes, while the accuracy of other models varies significantly with parameter size.
* **Original Vicuna-7B Baseline:** The accuracy of the "Original Vicuna-7B" model is shown as a baseline at approximately 58%.
### Interpretation
The data suggests that the "Ours-CPT" model outperforms the other models in terms of throughput, latency, perplexity, and accuracy. The "Ours-CPT" model maintains a consistent performance profile across different parameter sizes, while the performance of other models degrades significantly as the parameter size decreases. The throughput vs. latency plot indicates that the "Ours" model achieves high throughput with minimal latency, suggesting efficient processing. The perplexity and accuracy charts further support the superior performance of the "Ours-CPT" model, indicating better language modeling capabilities and higher prediction accuracy. The comparison against the "Original Vicuna-7B" baseline highlights the improvements achieved by the "Ours-CPT" model.