## Line Chart & Bar Charts: Performance Comparison of Language Models
### Overview
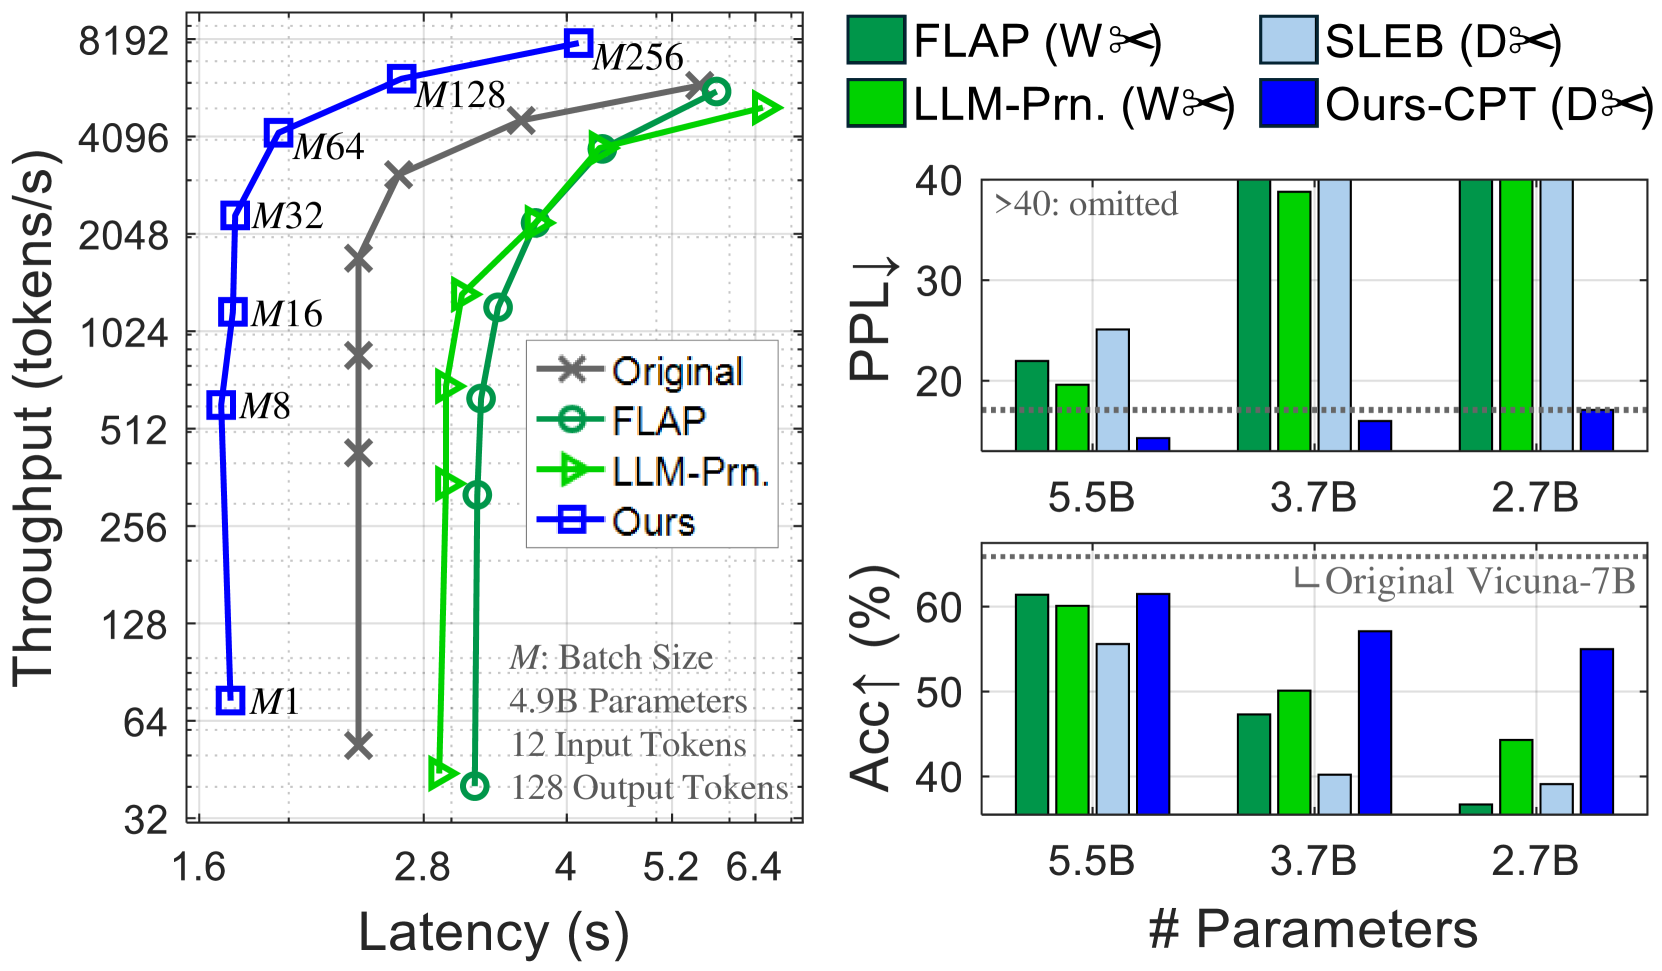
The image presents a performance comparison of several language models (Original, FLAP, LLM-Prn, and Ours) across three metrics: Throughput vs. Latency, Perplexity (PPL), and Accuracy (Acc1). The left chart shows throughput as a function of latency for different batch sizes. The two charts on the right show PPL and Acc1 as a function of model size (number of parameters).
### Components/Axes
**Left Chart:**
* **X-axis:** Latency (s), ranging from 1.6 to 6.4.
* **Y-axis:** Throughput (tokens/s), on a logarithmic scale from 32 to 8192.
* **Lines:** Represent different models:
* Original (Grey 'x' markers)
* FLAP (Green circle markers)
* LLM-Prn (Light Blue triangle markers)
* Ours (Dark Blue square markers)
* **Batch Size Labels:** "M" labels (M1, M8, M16, M32, M64, M128, M256) are positioned along the lines, indicating the batch size used for each data point.
* **Text Box:** "M: Batch Size", "4.9B Parameters", "12 Input Tokens", "128 Output Tokens"
**Top Right Chart (PPL):**
* **X-axis:** Number of Parameters (5.5B, 3.7B, 2.7B)
* **Y-axis:** Perplexity (PPL), ranging from 0 to 40.
* **Bars:** Represent different models, color-coded as follows:
* FLAP (Green)
* SLEB (Orange)
* LLM-Prn (Light Green)
* Ours-CPT (Light Blue)
* **Horizontal Line:** "Original Vicuna-7B" at approximately PPL = 33.
**Bottom Right Chart (Acc1):**
* **X-axis:** Number of Parameters (5.5B, 3.7B, 2.7B)
* **Y-axis:** Accuracy (Acc1) in percentage, ranging from 0 to 60.
* **Bars:** Represent different models, color-coded as follows:
* FLAP (Green)
* SLEB (Orange)
* LLM-Prn (Light Green)
* Ours-CPT (Light Blue)
* **Horizontal Line:** "Original Vicuna-7B" at approximately Acc1 = 60%.
**Legend:** Located in the top-right corner, associating colors with models.
### Detailed Analysis or Content Details
**Left Chart (Throughput vs. Latency):**
* **Original:** Starts at approximately 64 tokens/s at 1.6s latency, rapidly decreases to approximately 32 tokens/s at 2.8s latency.
* **FLAP:** Starts at approximately 4096 tokens/s at 1.6s latency, decreases to approximately 512 tokens/s at 2.8s latency, then plateaus around 512 tokens/s.
* **LLM-Prn:** Starts at approximately 2048 tokens/s at 1.6s latency, increases to approximately 4096 tokens/s at 4s latency, then plateaus.
* **Ours:** Starts at approximately 128 tokens/s at 1.6s latency, increases rapidly to approximately 8192 tokens/s at 5.2s latency.
**Top Right Chart (PPL):**
* **5.5B Parameters:** FLAP ~36, SLEB ~38, LLM-Prn ~32, Ours-CPT ~24.
* **3.7B Parameters:** FLAP ~37, SLEB ~39, LLM-Prn ~33, Ours-CPT ~25.
* **2.7B Parameters:** FLAP ~36, SLEB ~38, LLM-Prn ~32, Ours-CPT ~24.
**Bottom Right Chart (Acc1):**
* **5.5B Parameters:** FLAP ~52%, SLEB ~54%, LLM-Prn ~44%, Ours-CPT ~58%.
* **3.7B Parameters:** FLAP ~52%, SLEB ~54%, LLM-Prn ~44%, Ours-CPT ~58%.
* **2.7B Parameters:** FLAP ~52%, SLEB ~54%, LLM-Prn ~44%, Ours-CPT ~58%.
### Key Observations
* **Throughput/Latency Trade-off:** The left chart demonstrates a clear trade-off between throughput and latency. Increasing latency generally leads to higher throughput.
* **"Ours" Model:** The "Ours" model exhibits the highest throughput at higher latencies.
* **PPL:** The "Ours-CPT" model consistently achieves the lowest perplexity across all parameter sizes.
* **Acc1:** The "Ours-CPT" model consistently achieves the highest accuracy across all parameter sizes.
* **SLEB and FLAP:** SLEB and FLAP show similar performance in both PPL and Acc1.
* **Vicuna-7B:** The original Vicuna-7B model serves as a baseline, with performance comparable to the 5.5B parameter models.
### Interpretation
The data suggests that the "Ours" model represents a significant improvement over the other models, particularly in throughput at higher latencies. The "Ours-CPT" model also demonstrates superior performance in terms of both perplexity and accuracy, indicating better language modeling capabilities. The consistent performance of "Ours-CPT" across different parameter sizes suggests that it is a scalable and efficient model. The trade-off between throughput and latency is a common characteristic of language models, and the "Ours" model appears to effectively balance these two metrics. The horizontal lines representing the original Vicuna-7B model provide a useful benchmark for evaluating the performance of the other models. The fact that the "Ours-CPT" model outperforms Vicuna-7B across all metrics suggests that it represents a substantial advancement in language modeling technology. The consistent performance of SLEB and FLAP suggests they are comparable alternatives.