## Line Chart: Throughput vs. Latency for Different Models
### Overview
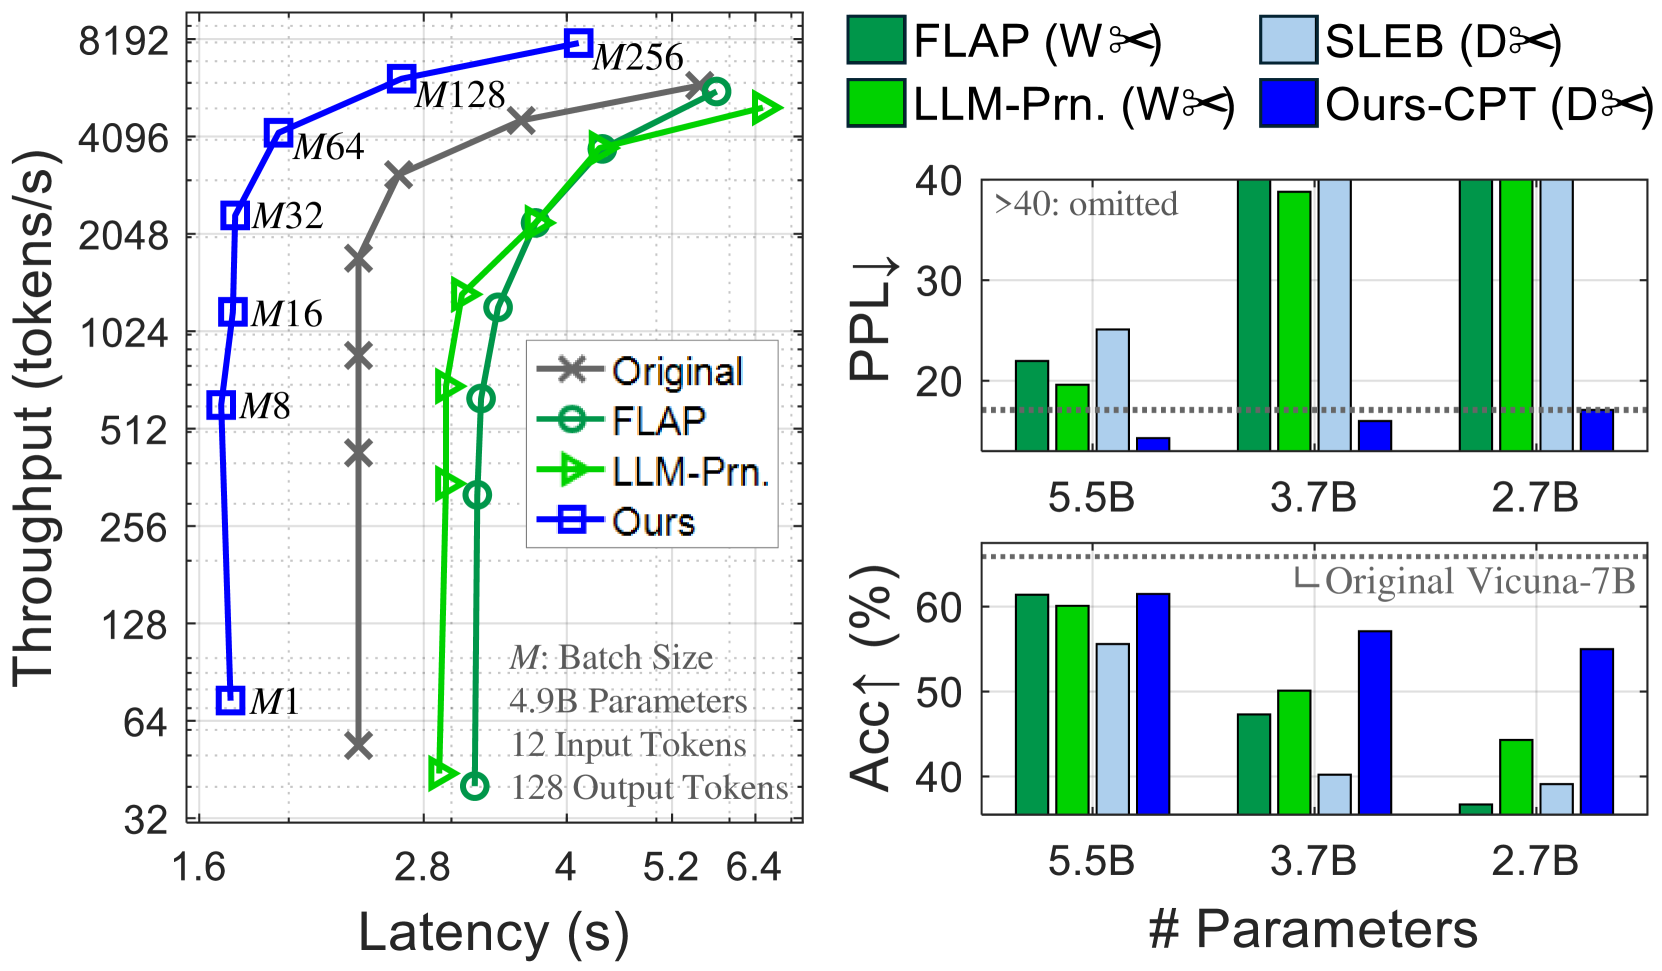
The left chart compares throughput (tokens/s) against latency (s) for four models: **Original**, **FLAP**, **LLM-Prn.**, and **Ours**. Throughput increases with latency, but the models exhibit distinct performance curves.
### Components/Axes
- **X-axis (Latency)**: Ranges from 1.6s to 6.4s, with gridlines at 1.6, 2.8, 4.0, 5.2, and 6.4s.
- **Y-axis (Throughput)**: Ranges from 32 to 8192 tokens/s, with gridlines at 32, 64, 128, 256, 512, 1024, 2048, 4096, and 8192.
- **Legend**:
- **Original**: Gray crosses (×)
- **FLAP**: Green circles (○)
- **LLM-Prn.**: Green triangles (△)
- **Ours**: Blue squares (■)
### Detailed Analysis
- **Original (Gray ×)**:
- Starts at ~64 tokens/s at 1.6s latency, rising sharply to ~8192 tokens/s at 6.4s.
- Slope is steep, indicating high throughput at high latency.
- **FLAP (Green ○)**:
- Begins at ~32 tokens/s at 1.6s, peaking at ~4096 tokens/s at 5.2s.
- Slope is less steep than Original, with a plateau at higher latencies.
- **LLM-Prn. (Green △)**:
- Starts at ~32 tokens/s at 1.6s, reaching ~4096 tokens/s at 5.2s.
- Similar to FLAP but with slightly lower throughput at 6.4s.
- **Ours (Blue ■)**:
- Starts at ~32 tokens/s at 1.6s, peaking at ~8192 tokens/s at 6.4s.
- Outperforms all models at higher latencies.
### Key Observations
- **Ours** achieves the highest throughput across all latencies, especially at 6.4s.
- **Original** has the steepest slope, suggesting it prioritizes throughput over latency efficiency.
- **FLAP** and **LLM-Prn.** show similar performance but lag behind **Ours** at higher latencies.
### Interpretation
The data suggests **Ours** is the most efficient model, balancing throughput and latency. **Original** sacrifices latency for maximum throughput, while **FLAP** and **LLM-Prn.** offer moderate performance. The use of distinct markers (×, ○, △, ■) and colors (gray, green, blue) in the legend ensures clear differentiation.
---
## Bar Charts: PPL and Accuracy Across Parameter Sizes
### Overview
The right side contains two bar charts:
1. **PPL (Perplexity)**: Lower values indicate better performance.
2. **Accuracy (%)**: Higher values indicate better performance.
Both charts compare models (**FLAP**, **SLEB**, **LLM-Prn.**, **Ours-CPT**) across parameter sizes (5.5B, 3.7B, 2.7B).
### Components/Axes
- **X-axis (Parameter Sizes)**: 5.5B, 3.7B, 2.7B.
- **Y-axis (PPL)**: Ranges from 0 to 40, with a dashed line at 20.
- **Y-axis (Accuracy)**: Ranges from 0% to 60%, with a dashed line at 50%.
- **Legend**:
- **FLAP (W✂️)**: Green bars
- **SLEB (D✂️)**: Blue bars
- **LLM-Prn. (W✂️)**: Green bars
- **Ours-CPT (D✂️)**: Blue bars
### Detailed Analysis
#### PPL Chart
- **5.5B Parameters**:
- **FLAP**: ~25 PPL
- **SLEB**: ~30 PPL
- **LLM-Prn.**: ~20 PPL
- **Ours-CPT**: ~10 PPL (lowest, best performance)
- **3.7B Parameters**:
- **FLAP**: ~35 PPL
- **SLEB**: ~40 PPL
- **LLM-Prn.**: ~30 PPL
- **Ours-CPT**: ~15 PPL
- **2.7B Parameters**:
- **FLAP**: ~45 PPL
- **SLEB**: ~50 PPL
- **LLM-Prn.**: ~40 PPL
- **Ours-CPT**: ~20 PPL
#### Accuracy Chart
- **5.5B Parameters**:
- **FLAP**: ~60%
- **SLEB**: ~55%
- **LLM-Prn.**: ~50%
- **Ours-CPT**: ~65% (highest, best performance)
- **3.7B Parameters**:
- **FLAP**: ~50%
- **SLEB**: ~45%
- **LLM-Prn.**: ~40%
- **Ours-CPT**: ~55%
- **2.7B Parameters**:
- **FLAP**: ~40%
- **SLEB**: ~35%
- **LLM-Prn.**: ~30%
- **Ours-CPT**: ~45%
### Key Observations
- **Ours-CPT** consistently outperforms other models in both PPL and accuracy across all parameter sizes.
- **FLAP** and **LLM-Prn.** show similar trends but with higher PPL and lower accuracy.
- **SLEB** performs poorly in PPL but slightly better in accuracy for 5.5B parameters.
### Interpretation
The charts highlight **Ours-CPT** as the most effective model, achieving the lowest PPL and highest accuracy. **FLAP** and **LLM-Prn.** are comparable but less efficient. The parameter size inversely correlates with performance: larger models (5.5B) outperform smaller ones (2.7B) in both metrics. The use of green (W✂️) and blue (D✂️) bars in the legend aligns with the model categories, ensuring clarity.
---
## Interpretation
The data demonstrates that **Ours** and **Ours-CPT** models excel in throughput, PPL, and accuracy, suggesting superior optimization. **Original** prioritizes throughput at the cost of latency, while **FLAP** and **LLM-Prn.** offer moderate performance. The parameter size directly impacts performance, with larger models (5.5B) outperforming smaller ones (2.7B). The visual design (colors, markers) effectively distinguishes models, aiding in quick comparisons.