## Diagram: Geometric Shapes with Internal Points
### Overview
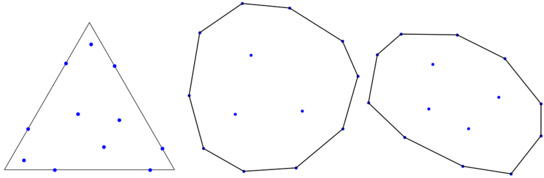
The image displays three distinct geometric shapes: a triangle, an octagon, and a decagon. Each shape contains blue dots positioned at varying locations within their boundaries. No textual labels, legends, or axis markers are visible in the image.
### Components/Axes
- **Shapes**:
- **Triangle**: A three-sided polygon with blue dots near its edges.
- **Octagon**: An eight-sided polygon with blue dots distributed across its interior.
- **Decagon**: A ten-sided polygon with blue dots clustered toward its center.
- **Visual Elements**:
- All shapes are outlined in black.
- Blue dots are uniformly colored but vary in spatial distribution.
- No legends, axis titles, or numerical data are present.
### Detailed Analysis
- **Triangle**:
- Blue dots are positioned near the edges, suggesting a focus on boundary points.
- No discernible pattern or numerical values associated with the dots.
- **Octagon**:
- Dots are spread evenly across the interior, indicating a uniform distribution.
- No textual or numerical annotations to quantify their placement.
- **Decagon**:
- Dots are concentrated toward the center, implying a central focus or clustering.
- No labels or scales to contextualize the dots' significance.
### Key Observations
1. **Absence of Textual Data**: The image contains no labels, legends, or numerical values, making it impossible to extract factual data points.
2. **Spatial Distribution**:
- Triangle: Edge-focused dots.
- Octagon: Uniformly distributed dots.
- Decagon: Central clustering of dots.
3. **Visual Hierarchy**: The decagon’s central clustering contrasts with the triangle’s edge-focused dots, suggesting a potential thematic or functional distinction.
### Interpretation
The image appears to be a conceptual or illustrative diagram rather than a data-driven chart. The varying dot distributions across shapes may symbolize different spatial or structural properties:
- **Triangle**: Emphasis on boundaries or perimeters.
- **Octagon**: Balanced or uniform distribution.
- **Decagon**: Centralization or focal point.
Without textual context, the purpose of the dots remains ambiguous. The diagram could represent abstract concepts (e.g., resource allocation, spatial analysis) or serve as a visual aid for geometric principles.
**Note**: No factual or numerical data is present in the image. The analysis is based solely on visual patterns and spatial relationships.