\n
## Diagram: Geometric Shapes with Internal Points
### Overview
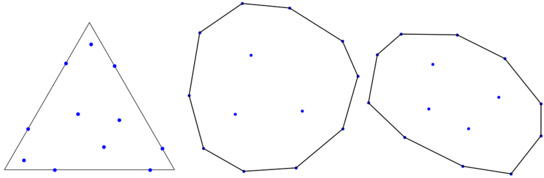
The image displays three distinct geometric shapes – a triangle, a nonagon (9-sided polygon), and a heptagon (7-sided polygon) – each containing several smaller, uniformly colored points within their boundaries. There are no axes, legends, or numerical data associated with the image. It appears to be a visual representation of shapes and point distributions, potentially for a geometric or spatial analysis.
### Components/Axes
The image consists solely of three geometric shapes and internal points. There are no labels, axes, or legends present.
### Detailed Analysis or Content Details
The shapes are arranged horizontally from left to right.
* **Triangle:** The triangle is positioned on the left. It has approximately 7 vertices. Within the triangle, there are approximately 6 small, uniformly colored points distributed seemingly randomly.
* **Nonagon:** The nonagon is in the center. It has approximately 9 vertices. Inside the nonagon, there are approximately 5 small, uniformly colored points.
* **Heptagon:** The heptagon is on the right. It has approximately 7 vertices. Within the heptagon, there are approximately 6 small, uniformly colored points.
The points within each shape are all the same color (a dark blue). The shapes themselves are defined by thin, light-colored lines.
### Key Observations
The number of points within each shape varies slightly. The triangle and heptagon have a similar number of points, while the nonagon has fewer. The points appear to be randomly distributed within each shape, with no obvious pattern or clustering.
### Interpretation
The image likely serves as a visual example for a geometric concept, such as point distribution within polygons, or could be a simplified representation of a spatial problem. The varying number of points within each shape might be intended to illustrate a difference in density or probability. Without additional context, it's difficult to determine the specific purpose of the image. The shapes themselves could represent areas or regions, and the points could represent events or objects within those regions. The lack of any quantitative data suggests the image is primarily illustrative rather than analytical. It is a visual demonstration of shapes and points, and does not provide any facts or data.