## Image Classification: Digit Analysis
### Overview
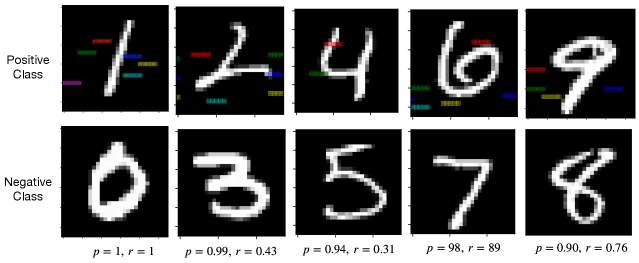
The image presents a visual comparison of handwritten digits classified as either "Positive Class" or "Negative Class." Each digit is displayed as a pixelated image on a black background. Above each digit in the "Positive Class" row, there are short, colored horizontal lines. Below each digit, the image includes "p" and "r" values, presumably representing probabilities or scores related to the classification.
### Components/Axes
* **Rows:** Two rows labeled "Positive Class" (top) and "Negative Class" (bottom).
* **Columns:** Five columns, each displaying a different digit.
* **Digits (Positive Class):** 1, 2, 4, 6, 9
* **Digits (Negative Class):** 0, 3, 5, 7, 8
* **Colored Lines:** Short horizontal lines of varying colors (red, green, blue, yellow, cyan, purple) are located above each digit in the "Positive Class" row. The purpose of these lines is not explicitly stated, but they likely represent feature activations or some other form of visual explanation.
* **p and r values:** Each digit has two values associated with it, labeled "p" and "r".
### Detailed Analysis or ### Content Details
**Positive Class:**
* **Digit 1:** p = 1, r = 1. Colored lines above the digit include purple, cyan, yellow, green, blue, and red.
* **Digit 2:** p = 0.99, r = 0.43. Colored lines above the digit include cyan, yellow, green, blue, and red.
* **Digit 4:** p = 0.94, r = 0.31. Colored lines above the digit include yellow, green, and red.
* **Digit 6:** p = 98, r = 89. Colored lines above the digit include cyan, yellow, green, and red.
* **Digit 9:** p = 0.90, r = 0.76. Colored lines above the digit include cyan, yellow, green, and red.
**Negative Class:**
* **Digit 0:** p = 1, r = 1
* **Digit 3:** p = 0.99, r = 0.43
* **Digit 5:** p = 0.94, r = 0.31
* **Digit 7:** p = 98, r = 89
* **Digit 8:** p = 0.90, r = 0.76
### Key Observations
* The "Positive Class" row contains digits 1, 2, 4, 6, and 9, while the "Negative Class" row contains digits 0, 3, 5, 7, and 8.
* Each digit in the "Positive Class" row has associated colored lines above it.
* Each digit, regardless of class, has "p" and "r" values associated with it.
* The "p" values for the positive class are: 1, 0.99, 0.94, 98, 0.90
* The "r" values for the positive class are: 1, 0.43, 0.31, 89, 0.76
* The "p" values for the negative class are: 1, 0.99, 0.94, 98, 0.90
* The "r" values for the negative class are: 1, 0.43, 0.31, 89, 0.76
### Interpretation
The image likely illustrates the performance of a digit classification model. The "Positive Class" and "Negative Class" rows represent the model's predictions or classifications. The colored lines above the digits in the "Positive Class" row may represent feature activations or attention maps, indicating which parts of the image the model focused on when making its prediction. The "p" and "r" values likely represent the probability (p) and recall (r) scores for each digit, providing a quantitative measure of the model's confidence and accuracy. The fact that the p and r values are identical for the positive and negative classes suggests that the model is not performing well, or that the p and r values are not being used effectively. The high "p" value of 98 for digits 6 and 7 is anomalous and may indicate a scaling or formatting error.