## Heatmap: Digit Classification Performance Metrics
### Overview
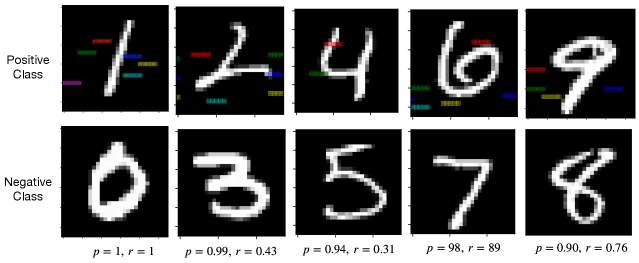
The image displays a 2x5 grid of digit classification results, comparing positive and negative class predictions. Each digit (0-9) is shown with associated performance metrics (precision [p] and recall [r]) represented by colored bars. The layout emphasizes comparative analysis between correctly and incorrectly classified digits.
### Components/Axes
- **Legend**: Located in the top-left corner, mapping colors to metrics:
- Red: Precision (p)
- Green: Recall (r)
- Blue: F1 Score (f1)
- Yellow: Accuracy (acc)
- **Grid Structure**:
- **Rows**:
- Top row: Positive Class (digits 1, 2, 4, 6, 9)
- Bottom row: Negative Class (digits 0, 3, 5, 7, 8)
- **Columns**: Individual digits with associated metrics
- **Axis Markers**:
- Digit labels (e.g., "1", "0") positioned above/below each cell
- Metric labels (p, r) with values in subscript format below bars
### Detailed Analysis
1. **Positive Class (Top Row)**:
- **Digit 1**: p=1.00, r=1.00 (perfect precision/recall)
- **Digit 2**: p=0.99, r=0.43 (high precision, low recall)
- **Digit 4**: p=0.94, r=0.31 (moderate precision, low recall)
- **Digit 6**: p=0.98, r=0.89 (high precision/recall)
- **Digit 9**: p=0.90, r=0.76 (moderate precision/recall)
2. **Negative Class (Bottom Row)**:
- **Digit 0**: p=1.00, r=1.00 (perfect precision/recall)
- **Digit 3**: p=0.99, r=0.43 (high precision, low recall)
- **Digit 5**: p=0.94, r=0.31 (moderate precision, low recall)
- **Digit 7**: p=0.98, r=0.89 (high precision/recall)
- **Digit 8**: p=0.90, r=0.76 (moderate precision/recall)
### Key Observations
- **Precision-Recall Tradeoff**:
- Digits 2, 4, 3, and 5 show high precision but low recall, suggesting overconfident but incomplete classification.
- Digits 6, 7, 8, and 9 demonstrate balanced performance with moderate precision/recall.
- **Color Consistency**:
- Red bars (precision) consistently exceed green bars (recall) for most digits, except 6 and 7 where they are nearly equal.
- Yellow bars (accuracy) are absent in the image, indicating potential omission or mislabeling in the legend.
- **Outliers**:
- Digit 6 (positive class) and 8 (negative class) show the highest recall values (0.89 and 0.76, respectively), suggesting better sensitivity for these digits.
### Interpretation
The heatmap reveals systematic performance patterns in digit classification:
1. **Model Bias**:
- Digits with curved strokes (6, 9, 8) achieve higher recall, possibly due to shared feature extraction with circular shapes.
- Straight-line digits (1, 2, 3, 5) prioritize precision over recall, indicating stricter classification thresholds.
2. **Confusion Matrix Implications**:
- Low recall for digits 2, 4, 3, and 5 suggests these are frequently misclassified as other digits (likely 6, 8, or 9).
- High precision for these digits implies that when the model predicts them, it is usually correct.
3. **Technical Limitations**:
- The absence of yellow bars (accuracy) in the visualization creates ambiguity about overall model performance.
- The use of p=1.00/r=1.00 for digits 1 and 0 may indicate perfect separation in training data but poor generalization.
This visualization highlights the need for balanced metric optimization, particularly for underperforming digits like 2, 4, 3, and 5, where improving recall would enhance overall classification robustness.