## Chart: Time Series of C(t) and D(t)
### Overview
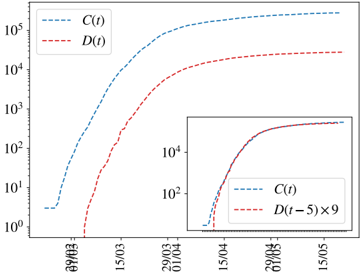
The image presents a time series chart comparing two datasets, C(t) and D(t), over a period from early March to mid-May. The main chart shows the raw data, while an inset chart displays a modified version of D(t) (D(t-5) * 9) alongside C(t). Both charts use a logarithmic scale for the y-axis.
### Components/Axes
* **Y-axis (Main Chart):** Logarithmic scale ranging from 10^0 (1) to 10^5 (100,000).
* **X-axis (Main Chart):** Time, with markers at 09/03, 15/03, 29/03, 01/04, 15/04, and 15/05.
* **Legend (Top-Left):**
* Blue dashed line: C(t)
* Red dashed line: D(t)
* **Y-axis (Inset Chart):** Logarithmic scale ranging from 10^0 (1) to 10^4 (10,000).
* **Legend (Inset Chart):**
* Blue dashed line: C(t)
* Red dashed line: D(t-5) * 9
### Detailed Analysis
**Main Chart:**
* **C(t) (Blue Dashed Line):**
* Trend: Initially flat, then exhibits a steep upward slope, eventually leveling off.
* Approximate Values: Starts around 10^1 (10) until 09/03, then rises to approximately 10^5 (100,000) by 15/04, and remains relatively stable thereafter.
* **D(t) (Red Dashed Line):**
* Trend: Starts low, increases sharply, and then continues to rise at a slower rate.
* Approximate Values: Starts below 10^0 (1) until 09/03, rises to approximately 10^4 (10,000) by 15/04, and reaches around 4 * 10^4 (40,000) by 15/05.
**Inset Chart:**
* **C(t) (Blue Dashed Line):**
* Trend: Similar to the main chart, initially flat, then a steep increase, and finally leveling off.
* **D(t-5) * 9 (Red Dashed Line):**
* Trend: Closely follows C(t), indicating a strong correlation after the transformation.
### Key Observations
* C(t) shows a rapid increase followed by a plateau.
* D(t) also increases rapidly but at a slower rate than C(t).
* The inset chart shows that D(t-5) * 9 closely mirrors C(t), suggesting a delayed and scaled relationship between the two datasets.
### Interpretation
The chart compares two time-dependent variables, C(t) and D(t). The inset chart suggests that D(t) might be related to C(t) with a time delay of 5 units and a scaling factor of 9. This could indicate that D(t) is a consequence of C(t), with the delay representing the time it takes for the effect to manifest, and the scaling factor representing the magnitude of the effect. The leveling off of both C(t) and D(t) suggests a saturation point or a control mechanism limiting further growth.