## Chart: Growth Curves of C(t) and D(t)
### Overview
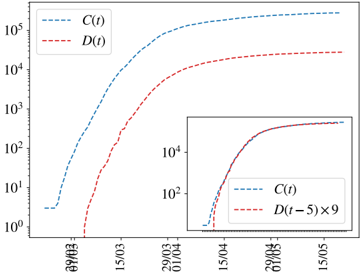
The image presents a chart displaying the growth of two functions, C(t) and D(t), over time. The chart uses a logarithmic y-axis. A smaller inset chart provides a zoomed-in view of the initial growth phase, showing a modified version of D(t).
### Components/Axes
* **X-axis:** Represents time, with markers approximately at: 09/03, 15/03, 29/03, 04/04, 15/04, 29/04, 07/05, 15/05.
* **Y-axis:** Represents the value of the functions, on a logarithmic scale. Markers are approximately at: 10<sup>0</sup>, 10<sup>1</sup>, 10<sup>2</sup>, 10<sup>3</sup>, 10<sup>4</sup>, 10<sup>5</sup>.
* **Legend (Top-Left):**
* `C(t)` - Represented by a dashed blue line.
* `D(t)` - Represented by a dashed red line.
* **Inset Chart Legend (Bottom-Right):**
* `C(t)` - Represented by a dashed blue line.
* `D(t-5) x 9` - Represented by a dashed red line.
### Detailed Analysis
**Main Chart:**
* **C(t) (Blue Line):** The blue line representing C(t) exhibits exponential growth.
* Around 09/03: Value is approximately 5.
* Around 15/03: Value is approximately 20.
* Around 29/03: Value is approximately 100.
* Around 04/04: Value is approximately 400.
* Around 15/04: Value is approximately 1500.
* Around 29/04: Value is approximately 6000.
* Around 07/05: Value is approximately 25000.
* Around 15/05: Value is approximately 100000.
* **D(t) (Red Line):** The red line representing D(t) also shows growth, but at a slower rate than C(t).
* Around 09/03: Value is approximately 0.5.
* Around 15/03: Value is approximately 2.
* Around 29/03: Value is approximately 10.
* Around 04/04: Value is approximately 40.
* Around 15/04: Value is approximately 150.
* Around 29/04: Value is approximately 600.
* Around 07/05: Value is approximately 2500.
* Around 15/05: Value is approximately 10000.
**Inset Chart:**
* **C(t) (Blue Line):** The blue line representing C(t) in the inset chart shows the initial exponential growth.
* Around 09/03: Value is approximately 5.
* Around 15/03: Value is approximately 20.
* Around 29/03: Value is approximately 100.
* **D(t-5) x 9 (Red Line):** The red line representing D(t-5) x 9 shows a similar initial growth pattern to C(t), but with a slightly lower initial value.
* Around 09/03: Value is approximately 4.
* Around 15/03: Value is approximately 15.
* Around 29/03: Value is approximately 80.
### Key Observations
* C(t) consistently grows faster than D(t) throughout the observed period.
* The inset chart highlights the initial growth phase, showing that D(t-5) x 9 is initially closer in value to C(t) than D(t) is.
* The logarithmic y-axis emphasizes the exponential nature of the growth.
* The scaling factor of 9 applied to D(t-5) in the inset chart suggests an attempt to align the growth curves for comparison.
### Interpretation
The chart demonstrates the differing growth rates of two functions, C(t) and D(t). C(t) exhibits a faster exponential growth compared to D(t). The inset chart, showing D(t-5) x 9, suggests that a time-shifted and scaled version of D(t) can more closely resemble the initial growth of C(t). This could indicate a delayed or attenuated response in the system modeled by D(t) relative to C(t). The use of a logarithmic scale is crucial for visualizing the exponential growth, as it allows for a clear comparison of the growth rates even when the values differ by several orders of magnitude. The data suggests that C(t) is a leading indicator or a more rapidly evolving process compared to D(t). The scaling factor of 9 and the time shift of 5 days in the inset chart imply a specific relationship between the two functions, potentially representing a lag and amplification effect.