## Candlestick Chart: Stock Price Movement (Oct 2021 - Apr 2022)
### Overview
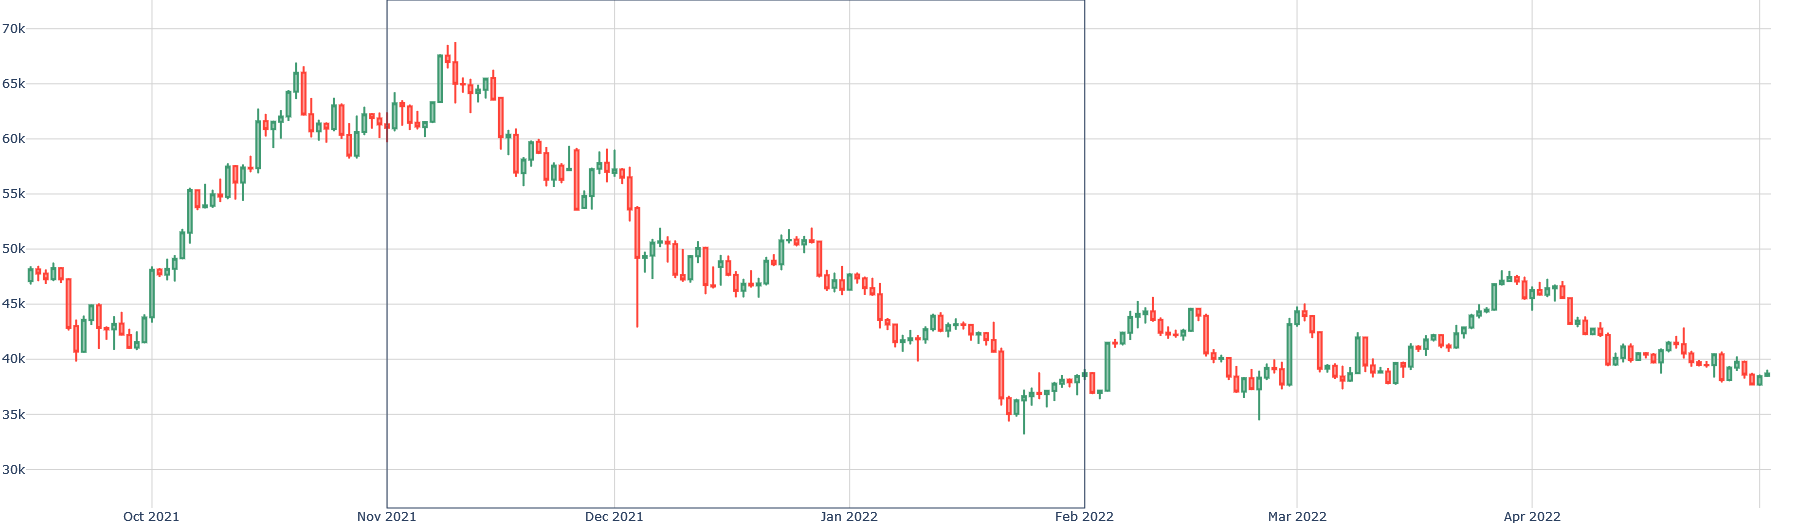
The image displays a candlestick chart tracking stock price fluctuations over eight months. The chart shows significant volatility, with a peak in late 2021 followed by a sharp decline and partial recovery. Green candlesticks represent upward price movement, while red candlesticks indicate downward trends.
### Components/Axes
- **X-axis (Horizontal)**: Timeframe labeled with months (Oct 2021 to Apr 2022), divided into approximate weekly intervals.
- **Y-axis (Vertical)**: Price scale ranging from 30,000 to 70,000, marked in 5,000 increments.
- **Legend**: Located in the top-right corner, using green (#228B22) for price increases and red (#B22222) for decreases.
- **Gridlines**: Subtle gray lines at 5,000-unit intervals for reference.
### Detailed Analysis
1. **Initial Uptrend (Oct-Nov 2021)**:
- Prices rose from ~48,000 to ~68,000.
- Notable peaks: ~65,000 (Oct 15), ~67,000 (Oct 29), ~68,000 (Nov 12).
- Sharp correction in late November to ~60,000.
2. **December 2021 Crash**:
- Steep decline from ~68,000 to ~45,000.
- Largest single drop: ~13,000 between Nov 26 and Dec 3.
- Bottomed at ~45,000 by Dec 24.
3. **January 2022 Recovery**:
- Gradual climb to ~50,000 by Jan 15.
- Volatile mid-January: ~48,000 to ~52,000.
- Sharp drop to ~42,000 by Jan 29.
4. **February 2022**:
- Recovery to ~48,000 by Feb 12.
- Sharp decline to ~35,000 by Feb 26.
- Final rebound to ~40,000 by Mar 5.
5. **March-April 2022**:
- Sideways movement between ~38,000 and ~45,000.
- Notable volatility: ~42,000 to ~46,000 in late March.
- Ended at ~39,000 by Apr 30.
### Key Observations
- **Peak-to-Trough Decline**: ~23,000 drop from Nov 12 peak to Dec 24 low.
- **Recovery Phase**: ~13,000 gain from Dec 24 to Mar 5.
- **Volatility Clusters**:
- High volatility in late November/early December.
- Secondary volatility in late January/February.
- **Price Range**: ~35,000 (lowest) to ~68,000 (highest).
### Interpretation
The chart reveals a classic bear market pattern with:
1. **Bullish Phase (Oct-Nov 2021)**: Strong upward momentum followed by profit-taking.
2. **Bearish Phase (Dec 2021-Feb 2022)**: Sharp correction and prolonged consolidation.
3. **Recovery Attempt (Mar-Apr 2022)**: Limited rebound with persistent selling pressure.
The data suggests external factors (e.g., macroeconomic news, sector-specific events) likely triggered the December crash. The subsequent recovery indicates resilience but fails to reclaim pre-crash highs, implying structural weakness or ongoing market uncertainty. The April 2022 price (~39,000) represents a 20% drawdown from the November peak, signaling potential long-term bearish sentiment.