## Diagram: Processor Task Dependency
### Overview
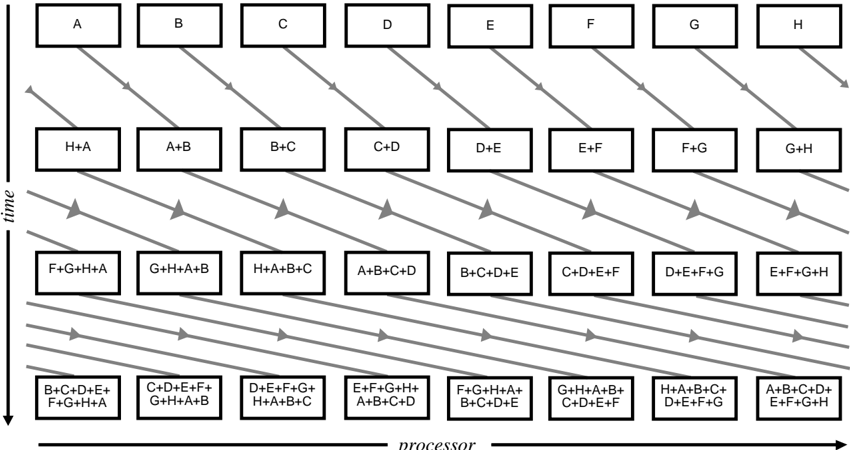
The image is a diagram illustrating the dependencies of tasks across multiple processors over time. It shows how the output of one task (represented by a letter) is used as input for subsequent tasks, both on the same processor and across different processors. The diagram visualizes a parallel processing workflow, where tasks are chained together, and the completion of one task triggers the start of another.
### Components/Axes
* **X-axis:** Labeled "processor," representing different processing units.
* **Y-axis:** Labeled "time," indicating the progression of tasks.
* **Nodes:** Rectangular boxes representing tasks, labeled with letters (A, B, C, D, E, F, G, H) or combinations of letters (e.g., H+A, A+B+C+D).
* **Arrows:** Gray arrows indicating the flow of data and dependencies between tasks. The arrows point diagonally downwards from left to right.
### Detailed Analysis
The diagram can be broken down into rows representing different time steps.
* **Row 1 (Top):**
* Tasks A, B, C, D, E, F, G, and H are initiated on separate processors.
* **Row 2:**
* Task H+A depends on the output of tasks H and A.
* Task A+B depends on the output of tasks A and B.
* Task B+C depends on the output of tasks B and C.
* Task C+D depends on the output of tasks C and D.
* Task D+E depends on the output of tasks D and E.
* Task E+F depends on the output of tasks E and F.
* Task F+G depends on the output of tasks F and G.
* Task G+H depends on the output of tasks G and H.
* **Row 3:**
* Task F+G+H+A depends on the output of tasks F+G and H+A.
* Task G+H+A+B depends on the output of tasks G+H and A+B.
* Task H+A+B+C depends on the output of tasks H+A and B+C.
* Task A+B+C+D depends on the output of tasks A+B and C+D.
* Task B+C+D+E depends on the output of tasks B+C and D+E.
* Task C+D+E+F depends on the output of tasks C+D and E+F.
* Task D+E+F+G depends on the output of tasks D+E and F+G.
* Task E+F+G+H depends on the output of tasks E+F and G+H.
* **Row 4 (Bottom):**
* Task B+C+D+E+F+G+H+A depends on the output of tasks F+G+H+A.
* Task C+D+E+F+G+H+A+B depends on the output of tasks G+H+A+B.
* Task D+E+F+G+H+A+B+C depends on the output of tasks H+A+B+C.
* Task E+F+G+H+A+B+C+D depends on the output of tasks A+B+C+D.
* Task F+G+H+A+B+C+D+E depends on the output of tasks B+C+D+E.
* Task G+H+A+B+C+D+E+F depends on the output of tasks C+D+E+F.
* Task H+A+B+C+D+E+F+G depends on the output of tasks D+E+F+G.
* Task A+B+C+D+E+F+G+H depends on the output of tasks E+F+G+H.
### Key Observations
* Each task in a row depends on the output of two tasks from the previous row.
* The dependencies shift diagonally, indicating that data is being passed between processors.
* The complexity of the tasks increases over time, as more data is combined.
### Interpretation
The diagram illustrates a parallel processing pipeline where data is processed in stages. Each processor performs a specific task, and the output of that task is passed to the next processor in the pipeline. This allows for efficient processing of large amounts of data, as multiple processors can work on different parts of the data simultaneously. The diagram demonstrates how tasks are chained together and how data flows between processors to achieve a final result. The increasing complexity of tasks over time suggests that the pipeline is designed to perform increasingly complex operations on the data as it progresses through the system.