\n
## Diagram: Parallel Processing Dependency Chart
### Overview
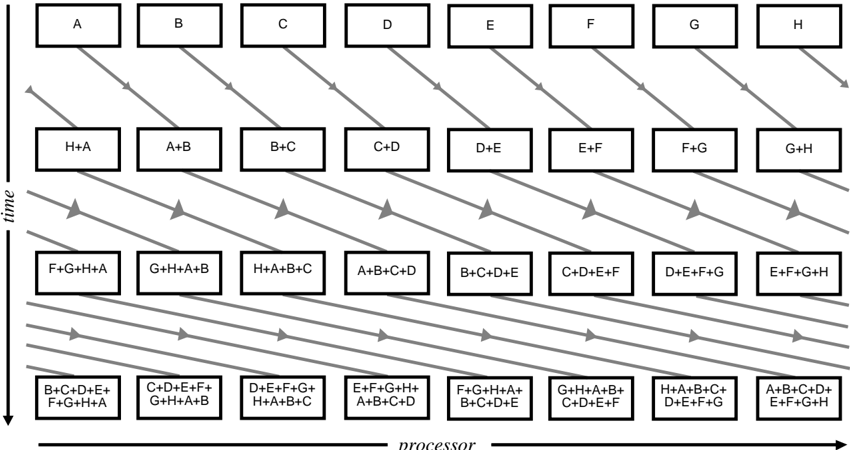
The image depicts a diagram illustrating the dependencies and execution flow of a parallel processing algorithm. It shows how data elements (A through H) are combined over time using a processor. The diagram visualizes a series of additions, where the results of previous operations become inputs for subsequent ones. The diagram is oriented with "time" increasing downwards and "processor" extending horizontally.
### Components/Axes
* **Axes:**
* Vertical Axis: Labeled "time", indicating the progression of the algorithm.
* Horizontal Axis: Labeled "processor", representing the computational resource.
* **Data Elements:** A, B, C, D, E, F, G, H – these are the initial input values.
* **Intermediate Results:** Combinations of data elements (e.g., H+A, A+B, B+C+D+E, etc.) represent the results of additions at each time step.
* **Arrows:** Indicate the flow of data and dependencies between operations.
### Detailed Analysis
The diagram shows a series of additions performed in parallel. The initial row contains the individual data elements A through H. Each subsequent row represents a time step where additions are performed.
* **Time Step 1:**
* H+A
* A+B
* B+C
* C+D
* D+E
* E+F
* F+G
* G+H
* **Time Step 2:**
* F+G+H+A
* G+A+H+B
* H+A+B+C
* A+B+C+D
* B+C+D+E
* C+D+E+F
* D+E+F+G
* E+F+G+H
* **Time Step 3:**
* B+C+D+E+F+G+H+A
* C+D+E+F+G+H+A+B
* D+E+F+G+H+A+B+C
* E+F+G+H+A+B+C+D
* F+G+H+A+B+C+D+E
* G+H+A+B+C+D+E+F
* H+A+B+C+D+E+F+G
* A+B+C+D+E+F+G+H
The final row represents the sum of all elements A through H, with each element appearing in a different combination. The arrows show that each addition in a given time step depends on the results of the additions in the previous time step.
### Key Observations
* The diagram demonstrates a progressive accumulation of data elements.
* The number of elements in each addition increases with each time step.
* The final row shows the complete summation of all elements in various permutations.
* The diagram illustrates a parallel processing approach, as multiple additions are performed simultaneously at each time step.
### Interpretation
This diagram likely represents a parallel algorithm for computing sums or performing other operations that benefit from parallelization. The diagram illustrates how the problem can be broken down into smaller, independent tasks (additions) that can be executed concurrently. The increasing complexity of the additions in each time step suggests that the algorithm is designed to efficiently combine data elements over time. The final row indicates that the algorithm ultimately computes all possible combinations of the input elements. This could be a step in a larger process, such as calculating statistics or performing data analysis. The diagram is a visual representation of a computational process, and it highlights the benefits of parallel processing in terms of reducing execution time and improving efficiency. The diagram does not provide any numerical data, but it clearly demonstrates the logical flow and dependencies of the algorithm.