## Diagram: Processor Task Flow Over Time
### Overview
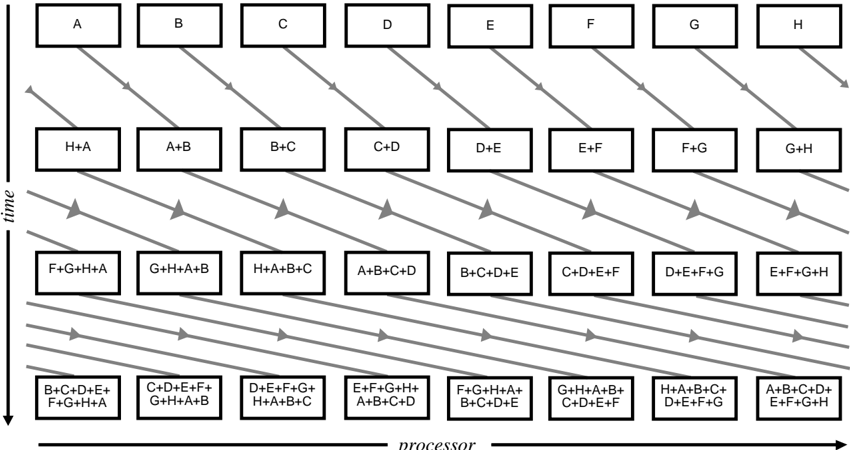
The diagram illustrates a multi-stage process flow across processors over time. It features a grid of labeled boxes (A-H) arranged in rows, with arrows connecting combinations of these boxes diagonally downward. The vertical axis represents "time" (progressing downward), and the horizontal axis represents "processor" (progressing left to right). Each row represents a time step, with boxes in each row showing combinations of processors active at that step.
### Components/Axes
- **Vertical Axis (Time)**: Labeled "time" with a downward arrow, indicating progression from top (earliest) to bottom (latest).
- **Horizontal Axis (Processor)**: Labeled "processor," with boxes A-H arranged sequentially from left to right.
- **Boxes**:
- Top row: Single processors (A, B, C, D, E, F, G, H).
- Subsequent rows: Combinations of processors (e.g., H+A, A+B, B+C, etc.), increasing in complexity (pairs, triplets, quadruples).
- **Arrows**: Diagonal downward arrows connect boxes between rows, indicating dependencies or data flow between time steps.
### Detailed Analysis
- **Time Steps**:
1. **Row 1 (Top)**: Single processors (A-H).
2. **Row 2**: Pairs (H+A, A+B, B+C, C+D, D+E, E+F, F+G, G+H).
3. **Row 3**: Triplets (F+G+H+A, G+H+A+B, H+A+B+C, A+B+C+D, B+C+D+E, C+D+E+F, D+E+F+G, E+F+G+H).
4. **Row 4**: Quadruples (B+C+D+E+F+G+H+A, C+D+E+F+G+H+A+B, etc.).
- **Flow Pattern**: Arrows connect each box to the next row’s combinations, showing sequential dependencies. For example:
- Processor A in Row 1 connects to H+A and A+B in Row 2.
- Processor B in Row 1 connects to A+B and B+C in Row 2.
- **Combination Logic**: Each row’s boxes represent overlapping subsets of processors, with each subsequent row adding one additional processor to the combination (e.g., Row 2 pairs → Row 3 triplets → Row 4 quadruples).
### Key Observations
- **Progressive Complexity**: Processor combinations grow in size (single → pairs → triplets → quadruples) as time progresses.
- **Overlap Consistency**: Each combination in a row overlaps with adjacent combinations by one processor (e.g., H+A and A+B share processor A).
- **Cyclic Dependency**: The final row’s combinations loop back to earlier processors (e.g., F+G+H+A includes A, the first processor).
### Interpretation
This diagram models a **parallel computing workflow** where tasks are distributed across processors and recombined over time. The increasing complexity of processor combinations suggests:
1. **Load Balancing**: Tasks are dynamically redistributed to optimize resource usage.
2. **Dependency Chains**: Arrows indicate that each time step’s output depends on the prior step’s results, forming a pipeline.
3. **Scalability**: The system scales processor involvement to handle larger tasks, possibly for distributed computing or real-time processing.
The cyclic dependency in the final row (e.g., F+G+H+A) implies a **feedback loop** or **re-initialization** of the process, ensuring continuity across time steps. This structure could represent algorithms like **parallel prefix sums**, **distributed sorting**, or **stream processing pipelines**.