## Line Chart: DeepSeek-R1-Distill-Llama-8B
### Overview
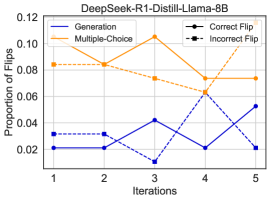
The image is a line chart comparing the proportion of flips across iterations for different methods (Generation and Multiple-Choice) and flip types (Correct Flip and Incorrect Flip) using the DeepSeek-R1-Distill-Llama-8B model. The x-axis represents iterations, and the y-axis represents the proportion of flips.
### Components/Axes
* **Title:** DeepSeek-R1-Distill-Llama-8B
* **X-axis:** Iterations (labeled 1, 2, 3, 4, 5)
* **Y-axis:** Proportion of Flips (scale from 0.02 to 0.12, incrementing by 0.02)
* **Legend:** Located at the top-left and top-right of the chart.
* **Generation:** Solid dark blue line
* **Multiple-Choice:** Solid orange line
* **Correct Flip:** Solid black line with circle markers
* **Incorrect Flip:** Dashed black line with square markers
### Detailed Analysis
**1. Generation (Solid Dark Blue Line):**
* Trend: Initially stable, then increases, decreases, and increases again.
* Data Points:
* Iteration 1: ~0.02
* Iteration 2: ~0.03
* Iteration 3: ~0.042
* Iteration 4: ~0.02
* Iteration 5: ~0.052
**2. Multiple-Choice (Solid Orange Line):**
* Trend: Starts high, decreases, increases, decreases, and stabilizes.
* Data Points:
* Iteration 1: ~0.084
* Iteration 2: ~0.084
* Iteration 3: ~0.105
* Iteration 4: ~0.073
* Iteration 5: ~0.073
**3. Correct Flip (Solid Black Line with Circle Markers):**
* Trend: Decreases and then increases.
* Data Points:
* Iteration 1: ~0.02
* Iteration 2: ~0.02
* Iteration 3: ~0.01
* Iteration 4: ~0.062
* Iteration 5: ~0.02
**4. Incorrect Flip (Dashed Black Line with Square Markers):**
* Trend: Increases and then decreases.
* Data Points:
* Iteration 1: ~0.032
* Iteration 2: ~0.032
* Iteration 3: ~0.01
* Iteration 4: ~0.062
* Iteration 5: ~0.1
### Key Observations
* The "Multiple-Choice" method consistently shows a higher proportion of flips compared to the "Generation" method.
* The "Correct Flip" and "Incorrect Flip" lines intersect at iteration 4, indicating a shift in the type of flips occurring.
* The proportion of "Incorrect Flips" increases significantly in the last iteration.
### Interpretation
The chart illustrates the performance of the DeepSeek-R1-Distill-Llama-8B model across different iterations, comparing the proportion of flips for "Generation" and "Multiple-Choice" methods, as well as "Correct" and "Incorrect" flips. The "Multiple-Choice" method generally leads to a higher proportion of flips, suggesting it might be more prone to changes or errors during the iterative process. The intersection of "Correct Flip" and "Incorrect Flip" lines at iteration 4 indicates a potential change in the model's behavior, with "Incorrect Flips" becoming more prevalent in the final iteration. This could suggest that the model is either learning or becoming less stable as iterations progress. Further analysis would be needed to determine the underlying causes of these trends.