## Line Chart: DeepSeek-R1-Distill-Llama-8B - Proportion of Flips Over Iterations
### Overview
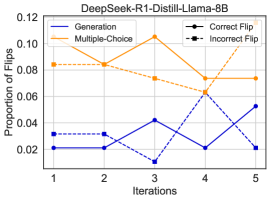
The image displays a line chart tracking the "Proportion of flips" across five iterations for a model or process named "DeepSeek-R1-Distill-Llama-8B". The chart compares four distinct metrics: Generation, Multiple-Choice, Correct Flip, and Incorrect Flip. The data suggests an analysis of model behavior or output changes over sequential steps.
### Components/Axes
* **Chart Title:** "DeepSeek-R1-Distill-Llama-8B" (centered at the top).
* **Y-Axis:** Labeled "Proportion of flips". The scale runs from 0.00 to 0.12, with major tick marks at intervals of 0.02 (0.00, 0.02, 0.04, 0.06, 0.08, 0.10, 0.12).
* **X-Axis:** Labeled "Iterations". The scale shows discrete integer values from 1 to 5.
* **Legend:** Positioned in the top-right corner of the plot area. It defines four data series:
* **Generation:** Solid blue line.
* **Multiple-Choice:** Solid orange line.
* **Correct Flip:** Black dashed line with circular markers.
* **Incorrect Flip:** Black dashed line with square markers.
* **Grid:** A light gray grid is present in the background.
### Detailed Analysis
**Data Series Trends & Approximate Values:**
1. **Generation (Blue Solid Line):**
* **Trend:** Fluctuates at a low level, with a small peak at iteration 3 and a rise at iteration 5.
* **Data Points (Approx.):**
* Iteration 1: 0.02
* Iteration 2: 0.02
* Iteration 3: 0.04
* Iteration 4: 0.02
* Iteration 5: 0.05
2. **Multiple-Choice (Orange Solid Line):**
* **Trend:** Starts high, peaks at iteration 3, then declines before a slight recovery.
* **Data Points (Approx.):**
* Iteration 1: 0.085
* Iteration 2: 0.08
* Iteration 3: 0.11 (Peak)
* Iteration 4: 0.07
* Iteration 5: 0.075
3. **Correct Flip (Black Dashed Line, Circle Markers):**
* **Trend:** Shows significant volatility. It drops sharply at iteration 3, spikes at iteration 4, and drops again at iteration 5.
* **Data Points (Approx.):**
* Iteration 1: 0.03
* Iteration 2: 0.03
* Iteration 3: 0.01 (Trough)
* Iteration 4: 0.06 (Peak)
* Iteration 5: 0.02
4. **Incorrect Flip (Black Dashed Line, Square Markers):**
* **Trend:** Shows a gradual decline from iteration 1 to 4, followed by a slight increase.
* **Data Points (Approx.):**
* Iteration 1: 0.085
* Iteration 2: 0.08
* Iteration 3: 0.075
* Iteration 4: 0.065 (Trough)
* Iteration 5: 0.075
### Key Observations
* **Highest Value:** The highest recorded proportion is for **Multiple-Choice** at iteration 3 (~0.11).
* **Lowest Value:** The lowest recorded proportion is for **Correct Flip** at iteration 3 (~0.01).
* **Convergence at Iteration 4:** At iteration 4, the values for **Multiple-Choice** (~0.07) and **Correct Flip** (~0.06) are very close, representing a point where these two metrics nearly intersect.
* **Volatility:** The **Correct Flip** series exhibits the most dramatic swings between consecutive iterations (e.g., from 0.01 at iter 3 to 0.06 at iter 4).
* **Relative Positions:** The **Multiple-Choice** and **Incorrect Flip** lines generally maintain higher proportions than the **Generation** and **Correct Flip** lines throughout most iterations, except at iteration 4 where **Correct Flip** surpasses **Incorrect Flip**.
### Interpretation
This chart appears to analyze the stability or error-correction behavior of the "DeepSeek-R1-Distill-Llama-8B" model over iterative refinement steps. The "proportion of flips" likely refers to changes in model outputs or decisions between iterations.
* The high and peaking **Multiple-Choice** flip rate suggests that the model's answers to multiple-choice questions are highly unstable, especially around iteration 3, indicating a period of significant re-evaluation or uncertainty.
* The volatile **Correct Flip** rate is particularly interesting. The sharp drop at iteration 3 followed by a spike at iteration 4 could indicate a phase where the model first becomes more confident in its correct answers (fewer flips), then undergoes a correction phase where it changes many correct answers (possibly to incorrect ones, given the concurrent dip in **Incorrect Flip**).
* The relatively low and stable **Generation** flip rate implies that the model's open-ended generation outputs are more consistent across iterations compared to its discrete choice behaviors.
* The overall pattern does not show a simple convergence to stability. Instead, it reveals complex, non-monotonic dynamics where different aspects of model behavior (generation vs. choice, correct vs. incorrect) evolve differently over the iterative process. The iteration 3-4 window appears to be a critical period of significant change for the model's decision-making.