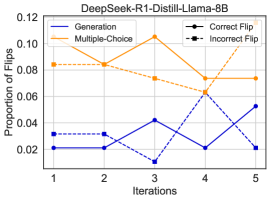
## Line Chart: Proportion of Flips in DeepSeek-R1-Distill-Llama-8B Across Iterations
### Overview
The chart visualizes the proportion of "flips" (likely model output changes) for two methods—**Generation** and **Multiple-Choice**—across five iterations of a model (DeepSeek-R1-Distill-Llama-8B). The y-axis represents the proportion of flips (0.02–0.12), and the x-axis represents iterations (1–5). Two lines are plotted: a blue line for **Generation** and an orange dashed line for **Multiple-Choice**. A legend on the right distinguishes **Correct Flip** (solid black) and **Incorrect Flip** (dashed black), though these are not directly mapped to the lines in the chart.
---
### Components/Axes
- **Title**: "DeepSeek-R1-Distill-Llama-8B" (top center).
- **Y-Axis**: "Proportion of Flips" (0.02–0.12, linear scale).
- **X-Axis**: "Iterations" (1–5, discrete steps).
- **Legend**:
- **Correct Flip**: Solid black (not directly mapped to lines).
- **Incorrect Flip**: Dashed black (not directly mapped to lines).
- **Lines**:
- **Generation**: Solid blue (left y-axis).
- **Multiple-Choice**: Dashed orange (right y-axis).
---
### Detailed Analysis
1. **Generation (Blue Line)**:
- **Iteration 1**: ~0.03.
- **Iteration 2**: ~0.03 (stable).
- **Iteration 3**: Drops to ~0.01 (lowest point).
- **Iteration 4**: Rises to ~0.05.
- **Iteration 5**: Slightly decreases to ~0.04.
- **Trend**: U-shaped curve with a sharp dip at iteration 3.
2. **Multiple-Choice (Orange Dashed Line)**:
- **Iteration 1**: ~0.08.
- **Iteration 2**: ~0.08 (stable).
- **Iteration 3**: Peaks at ~0.11 (highest point).
- **Iteration 4**: Drops to ~0.07.
- **Iteration 5**: Remains at ~0.07.
- **Trend**: Initial stability, sharp peak at iteration 3, then gradual decline.
3. **Legend Elements**:
- **Correct Flip** and **Incorrect Flip** are defined but not visually represented in the chart. This may indicate a separate metric or a misalignment in the visualization.
---
### Key Observations
- **Generation** shows a significant drop in flips at iteration 3, followed by a recovery. This could suggest model stabilization or a shift in output behavior.
- **Multiple-Choice** exhibits a peak at iteration 3, followed by a decline, indicating potential overfitting or increased variability in early iterations.
- The **legend** labels (**Correct Flip**, **Incorrect Flip**) do not correspond to the plotted lines, suggesting either a missing data series or a labeling error.
---
### Interpretation
- The **Generation** method’s U-shaped trend implies that flips initially decrease (possibly due to model refinement) but increase again later, which might reflect instability or adaptation to new data.
- The **Multiple-Choice** method’s peak at iteration 3 suggests higher variability or uncertainty during that phase, followed by stabilization. This could indicate a trade-off between accuracy and consistency.
- The absence of direct mapping between the legend labels and the lines raises questions about the chart’s completeness. If **Correct Flip** and **Incorrect Flip** are meant to represent subsets of the lines, additional data or annotations are required for clarity.
- The divergence between the two methods highlights differences in how flips are distributed across iterations, potentially reflecting distinct algorithmic approaches (e.g., generative vs. constrained output generation).
---
### Spatial Grounding
- **Legend**: Top-right corner (aligned with the chart’s upper boundary).
- **Lines**: Generation (blue) on the left y-axis, Multiple-Choice (orange) on the right y-axis.
- **Axes**: X-axis (bottom), Y-axis (left and right for dual-scale representation).
---
### Content Details
- **Numerical Approximations** (with uncertainty):
- **Generation**: 0.03 (±0.01), 0.03 (±0.01), 0.01 (±0.01), 0.05 (±0.01), 0.04 (±0.01).
- **Multiple-Choice**: 0.08 (±0.01), 0.08 (±0.01), 0.11 (±0.01), 0.07 (±0.01), 0.07 (±0.01).
---
### Final Notes
The chart provides insights into model behavior across iterations but lacks clarity on the relationship between the legend labels and the plotted lines. Further context or data is needed to fully interpret the significance of **Correct Flip** and **Incorrect Flip** in this visualization.