## Scatter Plot: LongBench Accuracy vs KV Cache Size for 2wikimQA Dataset
### Overview
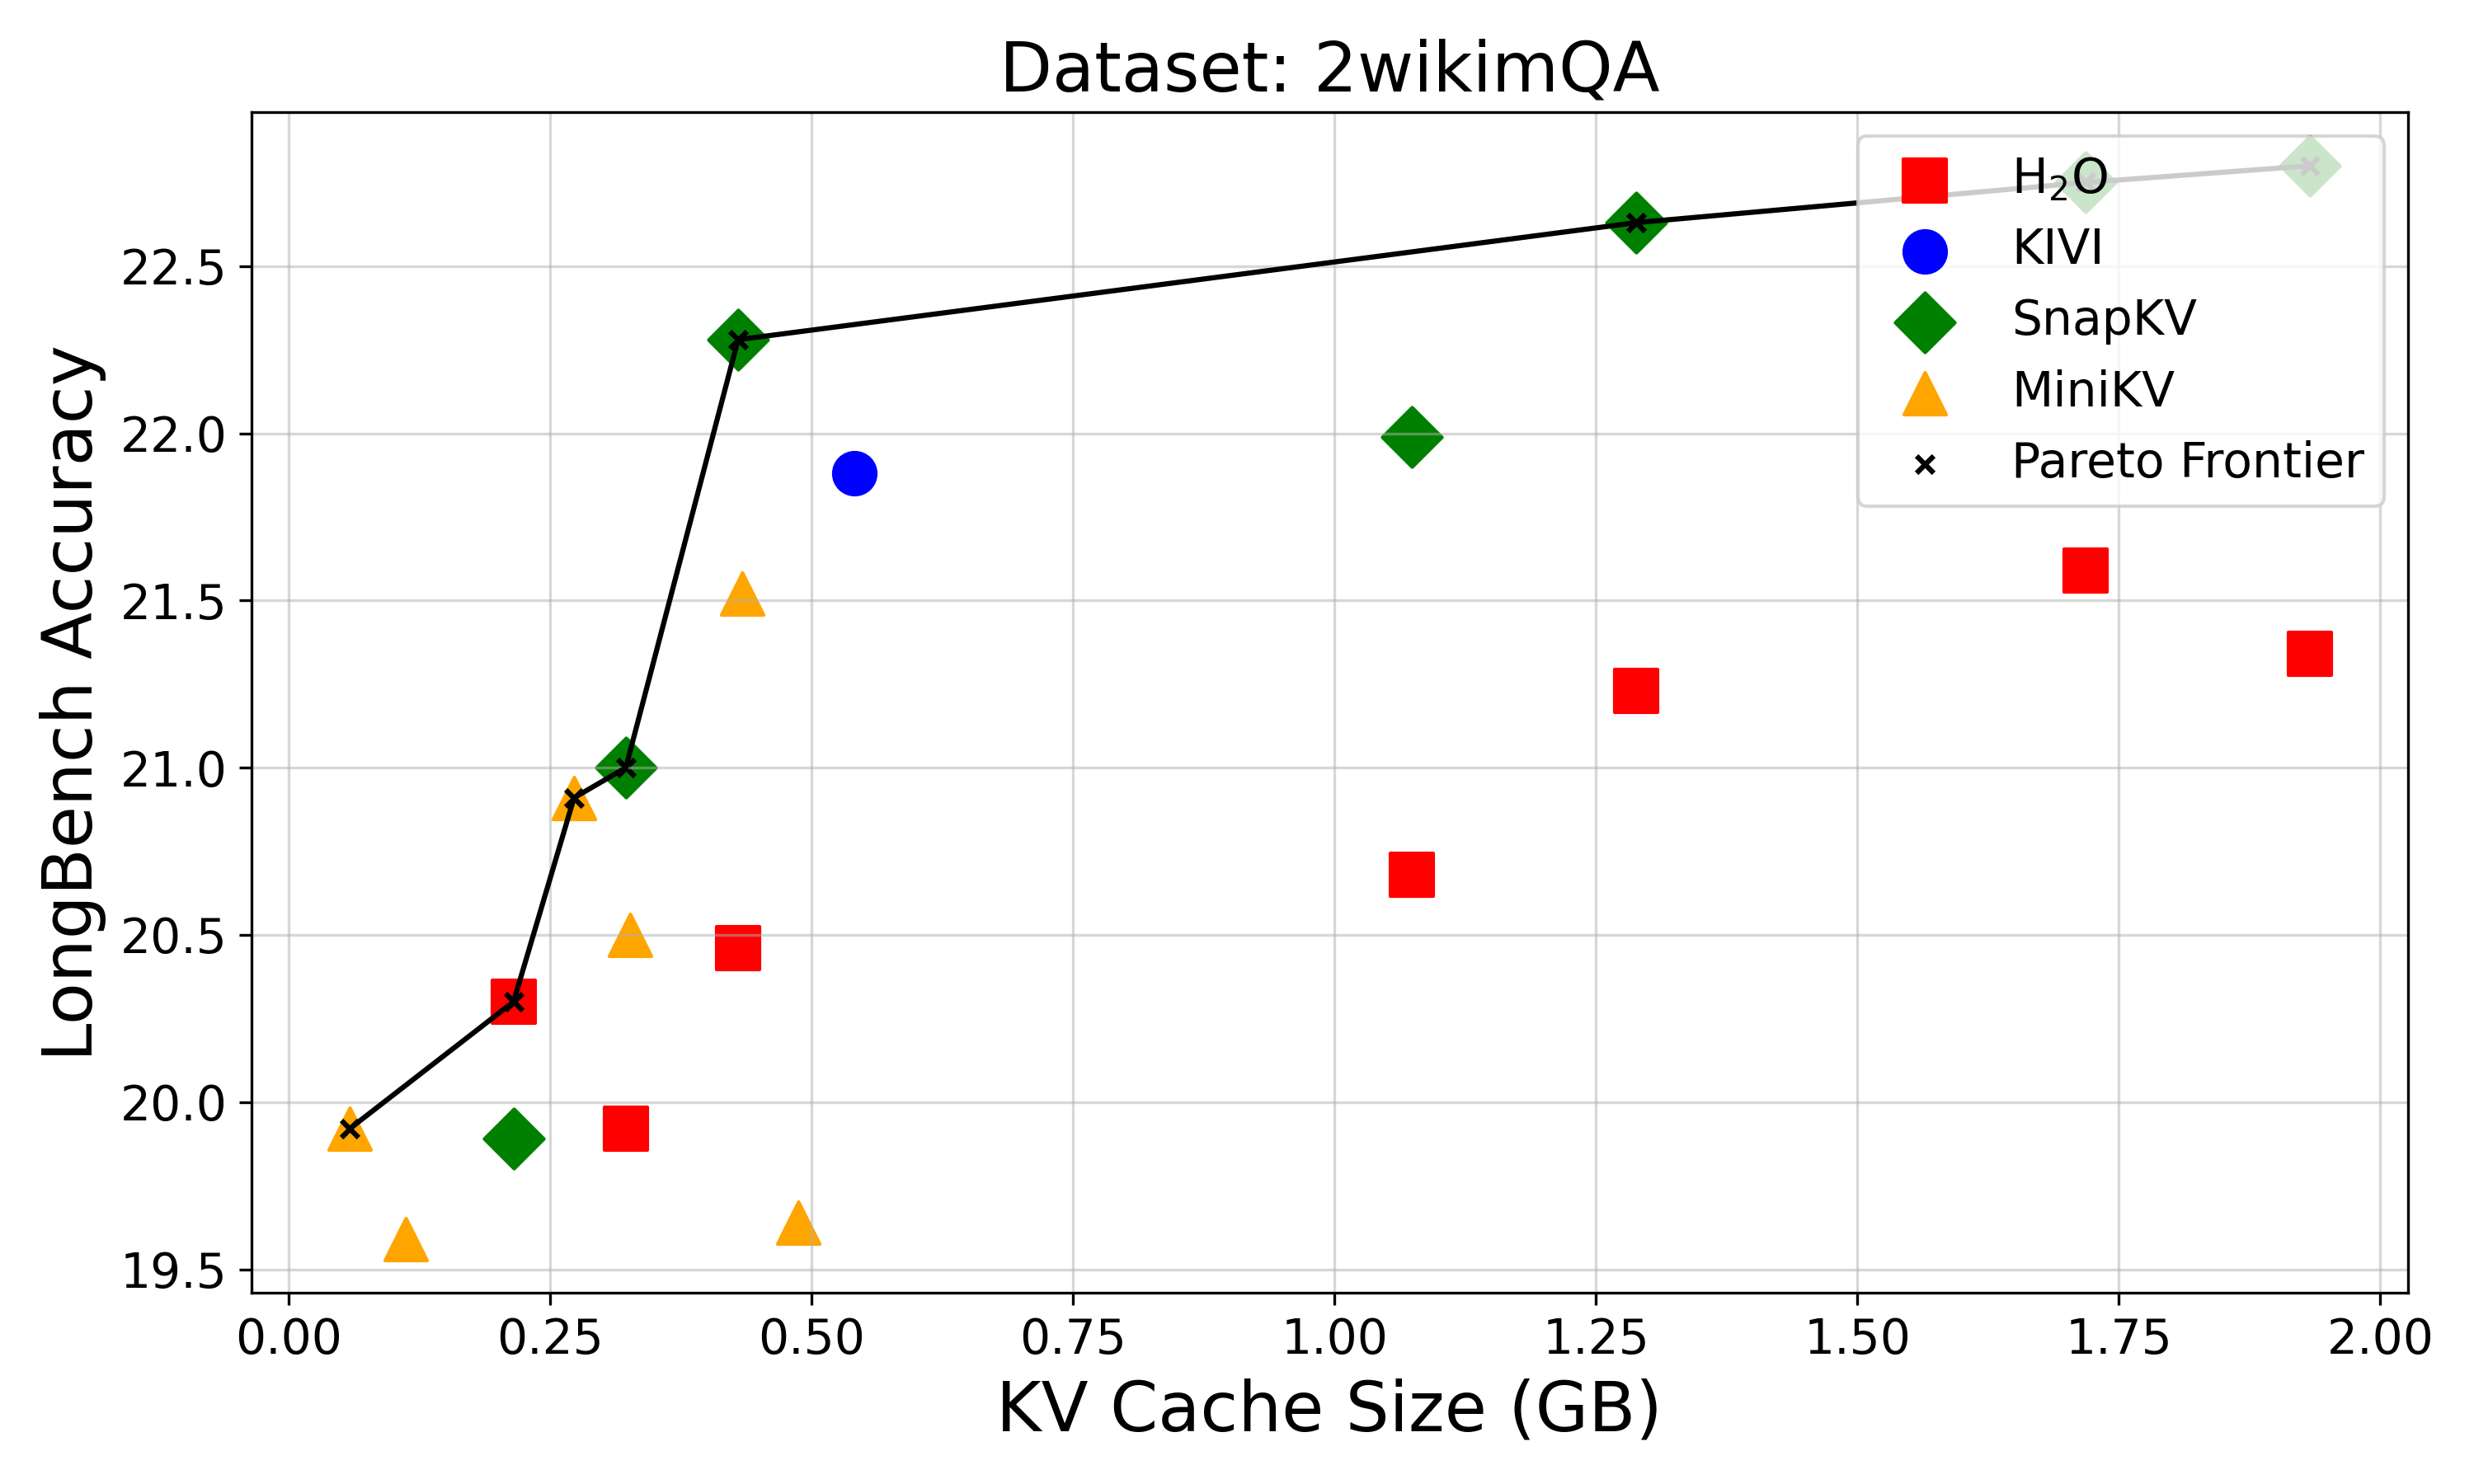
The image is a scatter plot visualizing the relationship between KV Cache Size (in GB) and LongBench Accuracy for different models on the 2wikimQA dataset. The plot includes five data series (H2O, KIVI, SnapKV, MiniKV, and Pareto Frontier) with distinct markers and colors. The Pareto Frontier is represented as a line connecting optimal data points.
### Components/Axes
- **X-axis**: KV Cache Size (GB), ranging from 0.00 to 2.00 GB in 0.25 increments.
- **Y-axis**: LongBench Accuracy, ranging from 19.5 to 23.0.
- **Legend**: Located in the top-right corner, with the following mappings:
- **Red squares**: H2O
- **Blue circle**: KIVI
- **Green diamonds**: SnapKV
- **Yellow triangles**: MiniKV
- **Black crosses**: Pareto Frontier
- **Pareto Frontier**: A black line connecting optimal data points, indicating the trade-off between cache size and accuracy.
### Detailed Analysis
#### Data Series Trends
1. **H2O (Red Squares)**:
- Points: (0.25, 20.3), (0.5, 20.5), (1.0, 20.7), (1.5, 21.6), (1.75, 21.5), (2.0, 21.4)
- Trend: Slight upward trend with a peak at 1.5 GB (21.6) followed by a minor decline.
2. **KIVI (Blue Circle)**:
- Single point: (0.5, 21.9)
- Trend: Isolated high-performance data point at 0.5 GB.
3. **SnapKV (Green Diamonds)**:
- Points: (0.3, 21.0), (0.4, 22.3), (1.0, 22.0), (1.3, 22.7)
- Trend: Strong upward trend, peaking at 1.3 GB (22.7).
4. **MiniKV (Yellow Triangles)**:
- Points: (0.1, 19.6), (0.3, 20.9), (0.4, 20.5), (0.5, 19.7)
- Trend: Initial increase to 0.3 GB (20.9), followed by a decline.
5. **Pareto Frontier (Black Crosses)**:
- Points: (0.1, 19.6), (0.3, 20.9), (0.4, 21.0), (0.5, 21.9), (1.0, 22.0), (1.3, 22.7), (1.5, 22.6), (1.75, 22.8), (2.0, 23.0)
- Trend: Steady upward trajectory, representing the optimal trade-off between cache size and accuracy.
### Key Observations
- **Pareto Frontier Dominance**: The Pareto Frontier line consistently outperforms all other models, showing a clear upward trend as cache size increases.
- **H2O and MiniKV Underperformance**: These models exhibit lower accuracy across most cache sizes, with H2O showing a slight peak at 1.5 GB (21.6) and MiniKV peaking at 0.3 GB (20.9).
- **KIVI and SnapKV Efficiency**: KIVI achieves 21.9 accuracy at 0.5 GB, while SnapKV reaches 22.7 at 1.3 GB, indicating higher efficiency.
- **Anomalies**: H2O's accuracy drops slightly at 2.0 GB (21.4) despite increased cache size, suggesting diminishing returns.
### Interpretation
The data demonstrates that larger KV cache sizes generally correlate with higher LongBench Accuracy, but the relationship is not linear. The Pareto Frontier highlights the most efficient models (e.g., SnapKV and KIVI) that balance cache size and performance. H2O and MiniKV underperform, suggesting potential inefficiencies in their architecture or implementation. The Pareto Frontier's upward trend implies that optimizing cache size can significantly improve accuracy, but beyond a certain point (e.g., 1.75–2.0 GB), the gains may plateau or reverse. This analysis underscores the importance of model-specific optimization for KV cache size in achieving optimal performance on the 2wikimQA dataset.