## Line Graph: Comparative Analysis of Precipitation and Evaporation Index
### Overview
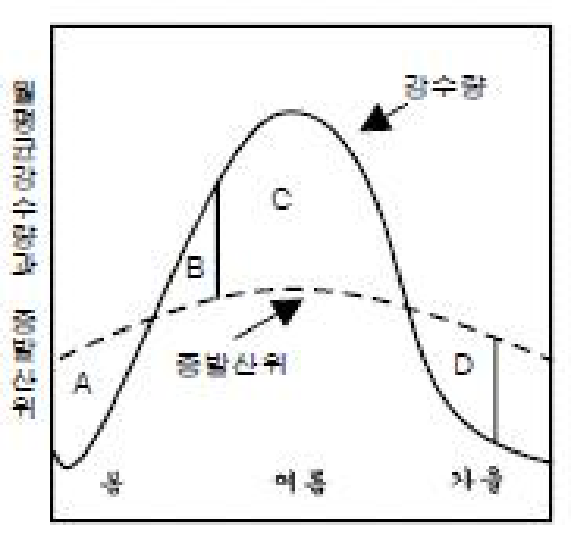
The image depicts a line graph comparing two metrics: "강수량" (Precipitation) and "증발산위" (Evaporation Index). The graph uses a solid line for Precipitation and a dashed line for Evaporation Index, plotted against a categorical x-axis labeled "증" (Increase), "더듬" (Fluctuation), and "저하" (Decline). The y-axis is labeled "종합산위" (Comprehensive Index).
### Components/Axes
- **Y-Axis**: "종합산위" (Comprehensive Index) – No numerical scale provided.
- **X-Axis**: Categorical labels:
- "증" (Increase)
- "더듬" (Fluctuation)
- "저하" (Decline)
- **Legend**:
- Solid line: "강수량" (Precipitation)
- Dashed line: "증발산위" (Evaporation Index)
- **Annotations**:
- Arrow labeled "증발산위" points to the dashed line.
- Arrow labeled "강수량" points to the solid line.
### Detailed Analysis
1. **Precipitation (Solid Line)**:
- Starts at a low value in the "증" (Increase) phase.
- Peaks at point **C** during the "더듬" (Fluctuation) phase.
- Declines sharply in the "저하" (Decline) phase.
- No numerical values provided, but the peak at C is visually the highest point.
2. **Evaporation Index (Dashed Line)**:
- Begins at point **A** in the "증" (Increase) phase.
- Reaches a local peak at point **B** during the "더듬" (Fluctuation) phase.
- Declines to point **D** in the "저하" (Decline) phase.
- Remains consistently below the Precipitation line throughout.
3. **Key Data Points**:
- **A**: Starting point of Evaporation Index.
- **B**: Peak of Evaporation Index during fluctuation.
- **C**: Peak of Precipitation during fluctuation.
- **D**: Terminal point of Evaporation Index in decline.
### Key Observations
- Precipitation exhibits a sharper peak (C) compared to Evaporation Index (B).
- Both metrics decline in the "저하" phase, but Precipitation drops more steeply.
- The Evaporation Index remains subordinate to Precipitation across all phases.
### Interpretation
The graph illustrates a relationship where Precipitation (solid line) dominates Evaporation Index (dashed line) in magnitude. The "더듬" (Fluctuation) phase shows the highest activity for both metrics, but Precipitation's peak is more pronounced. The decline phase ("저하") suggests a cooling or drying trend, with Precipitation decreasing faster than Evaporation. The lack of numerical values limits quantitative analysis, but the visual hierarchy emphasizes Precipitation's greater variability and impact. The arrows reinforce the directional trends, with "증발산위" (Evaporation) consistently following a secondary trajectory to "강수량" (Precipitation).