## Line Plot: Neuron Activation Distribution
### Overview
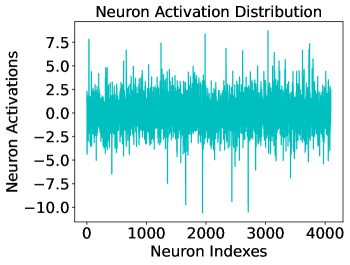
This image is a technical line chart visualizing the activation levels of individual neurons within a neural network layer. The data is plotted as a continuous, highly oscillatory line in a cyan/teal color against a white background. The chart shows the magnitude of "activations" for approximately 4,100 unique neuron indices.
### Components/Axes
* **Header (Top-Center):** Title text "Neuron Activation Distribution".
* **Y-Axis (Left):** Labeled "Neuron Activations". The scale ranges from -10.0 to 7.5, with major tick marks at intervals of 2.5 (-10.0, -7.5, -5.0, -2.5, 0.0, 2.5, 5.0, 7.5).
* **X-Axis (Bottom):** Labeled "Neuron Indexes". The scale ranges from 0 to approximately 4100, with major tick marks every 1000 units (0, 1000, 2000, 3000, 4000).
* **Data Series:** A single cyan line representing the activation value for each neuron index. There is no legend, as only one data series is present.
### Detailed Analysis
**Spatial Grounding & Trend Verification:**
* **Main Chart Area (Center):** The data series occupies the central rectangular region. The line exhibits a "white noise" or stochastic appearance, oscillating rapidly around a central baseline.
* **Visual Trend:** The overall trend is horizontal and stationary. There is no observable drift, upward slope, or downward slope as the neuron index increases. The mean appears to be very close to 0.0.
* **Data Density:** The line is extremely dense, indicating that data points are plotted for nearly every integer index between 0 and ~4100.
**Numerical Estimates:**
* **Central Mass:** The vast majority of neuron activations (estimated >95%) fall within the range of **[-2.5, 2.5]**.
* **Positive Peaks:** Several neurons show high positive activation. Notable spikes occur at:
* Index ~50: ~7.8
* Index ~1250: ~7.5
* Index ~1950: ~8.5
* Index ~3100: ~8.8 (Highest positive peak)
* **Negative Peaks:** Several neurons show significant negative activation. Notable spikes occur at:
* Index ~1700: ~-10.0
* Index ~2000: ~-10.8 (Lowest negative peak)
* Index ~2800: ~-10.5
### Key Observations
* **Zero-Centered:** The distribution is symmetric around the 0.0 axis.
* **High Variance Outliers:** While most neurons are quiet (near zero), a small subset of neurons (outliers) exhibit activations that are 4 to 5 times the standard deviation of the rest of the population.
* **Range Asymmetry:** The negative activations reach slightly further (~ -11.0) than the positive activations (~ +9.0).
### Interpretation
* **Activation Function:** The presence of significant negative values suggests that the layer is using an activation function that allows negative output (such as **Leaky ReLU, ELU, or Tanh**) or that this plot represents "pre-activations" (the values before a ReLU function is applied). If a standard ReLU were applied, all values below 0.0 would be clipped to zero.
* **Layer Health:** The zero-centered nature of the distribution suggests the network may be using **Batch Normalization** or a similar normalization technique to maintain stable gradients and prevent internal covariate shift.
* **Feature Sparsity:** The sharp spikes indicate that specific neurons are "firing" strongly. In a technical context, this suggests these specific neurons (e.g., index ~3100) have learned to recognize specific features in the input data that are highly present in the current sample.
* **Network Architecture:** The x-axis ending just past 4000 strongly suggests a layer size of **4096 neurons**, which is a standard power-of-two dimension for fully connected (dense) layers in deep learning architectures.