\n
## Line Chart: Neuron Activation Distribution
### Overview
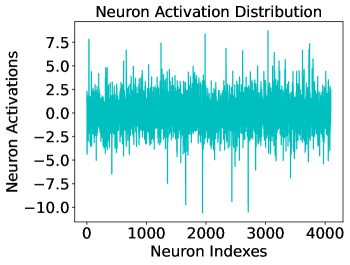
The image presents a line chart visualizing the distribution of neuron activations across neuron indices. The chart displays a fluctuating pattern of activation values, ranging from approximately -10 to 7.5, across a range of neuron indices from 0 to 4000.
### Components/Axes
* **Title:** "Neuron Activation Distribution" - positioned at the top-center of the chart.
* **X-axis:** "Neuron Indexes" - ranging from 0 to 4000, with tick marks at intervals of 1000.
* **Y-axis:** "Neuron Activations" - ranging from -10 to 7.5, with tick marks at intervals of 2.5.
* **Data Series:** A single teal-colored line representing the neuron activation values.
### Detailed Analysis
The line chart shows a highly variable pattern of neuron activations.
* **Initial Segment (0-1000):** The line fluctuates around a value of approximately 2.5, with activations ranging from roughly 0 to 5.
* **Middle Segment (1000-3000):** The line exhibits a more pronounced downward trend, with activations decreasing from around 2.5 to a minimum of approximately -10 around neuron index 2000. After the minimum, the line begins to rise again, reaching values around 2.5 by neuron index 3000.
* **Final Segment (3000-4000):** The line continues to fluctuate, remaining generally between -5 and 5, with some peaks reaching up to 7.5.
Approximate data points (extracted visually):
* Neuron Index 0: Activation ≈ 3.5
* Neuron Index 500: Activation ≈ 1.5
* Neuron Index 1000: Activation ≈ 2.0
* Neuron Index 1500: Activation ≈ -2.0
* Neuron Index 2000: Activation ≈ -8.0
* Neuron Index 2500: Activation ≈ 1.0
* Neuron Index 3000: Activation ≈ 2.5
* Neuron Index 3500: Activation ≈ 4.0
* Neuron Index 4000: Activation ≈ 0.5
### Key Observations
* The neuron activations are highly variable, indicating a dynamic system.
* There is a noticeable dip in activation values around neuron index 2000, representing a period of strong negative activation.
* The overall distribution appears roughly symmetrical around zero, although with significant fluctuations.
### Interpretation
The chart suggests that the neuron activations are not uniformly distributed. The observed fluctuations likely reflect the processing of different inputs or the dynamic state of the neural network. The dip in activation around neuron index 2000 could indicate a specific feature or pattern being processed that leads to a suppression of activity in those neurons. The overall pattern suggests a complex interplay of excitatory and inhibitory signals within the network. The data does not provide information about the specific function of these neurons or the task the network is performing, but it does offer insight into the internal activity patterns. The lack of a clear, consistent trend suggests the network is not stuck in a particular state, but is actively responding to changing inputs.