## Distribution Plot: Counterfactual Fairness Audit for Attribute "black"
### Overview
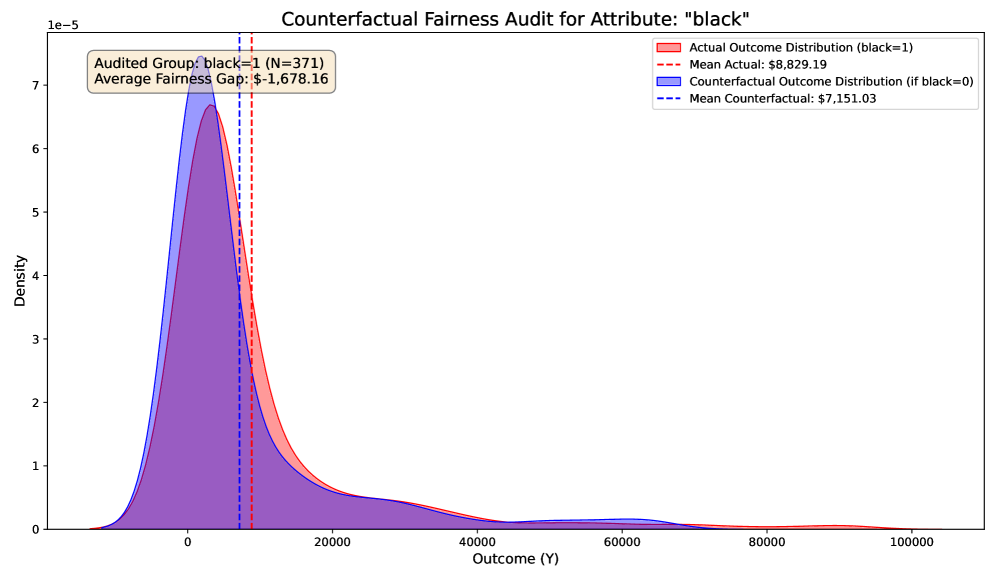
The image is a distribution plot comparing the actual outcome distribution for a group where "black=1" to the counterfactual outcome distribution if "black=0". It visualizes a fairness audit, showing the density of outcomes (Y) for both scenarios. The plot includes mean values for both distributions and an average fairness gap.
### Components/Axes
* **Title:** Counterfactual Fairness Audit for Attribute: "black"
* **X-axis:** Outcome (Y), ranging from 0 to 100000. Axis markers are present at 0, 20000, 40000, 60000, 80000, and 100000.
* **Y-axis:** Density, scaled by 1e-5. Axis markers are present at 0, 1, 2, 3, 4, 5, 6, and 7.
* **Legend (Top-Right):**
* **Red:** Actual Outcome Distribution (black=1)
* Mean Actual: $8,829.19
* **Blue:** Counterfactual Outcome Distribution (if black=0)
* Mean Counterfactual: $7,151.03
* **Annotation Box (Top-Left):**
* Audited Group: black=1 (N=371)
* Average Fairness Gap: $-1,678.16
### Detailed Analysis
* **Actual Outcome Distribution (Red):**
* The distribution is unimodal and skewed to the right.
* The peak density is approximately at an outcome value of 5000.
* The mean is indicated by a dashed red vertical line at $8,829.19.
* **Counterfactual Outcome Distribution (Blue):**
* The distribution is unimodal and skewed to the right.
* The peak density is approximately at an outcome value of 0.
* The mean is indicated by a dashed blue vertical line at $7,151.03.
### Key Observations
* The counterfactual distribution (blue) is shifted to the left compared to the actual distribution (red).
* The mean actual outcome ($8,829.19) is higher than the mean counterfactual outcome ($7,151.03).
* The average fairness gap is negative ($-1,678.16), indicating a disparity in outcomes.
### Interpretation
The plot suggests that there is a difference in outcomes between the group where "black=1" and the counterfactual scenario where "black=0". The negative fairness gap indicates that, on average, the "black=1" group experiences a lower outcome than what they would have if "black=0". The shift in the distributions and the difference in means support this conclusion. The data demonstrates a potential fairness issue related to the "black" attribute.