\n
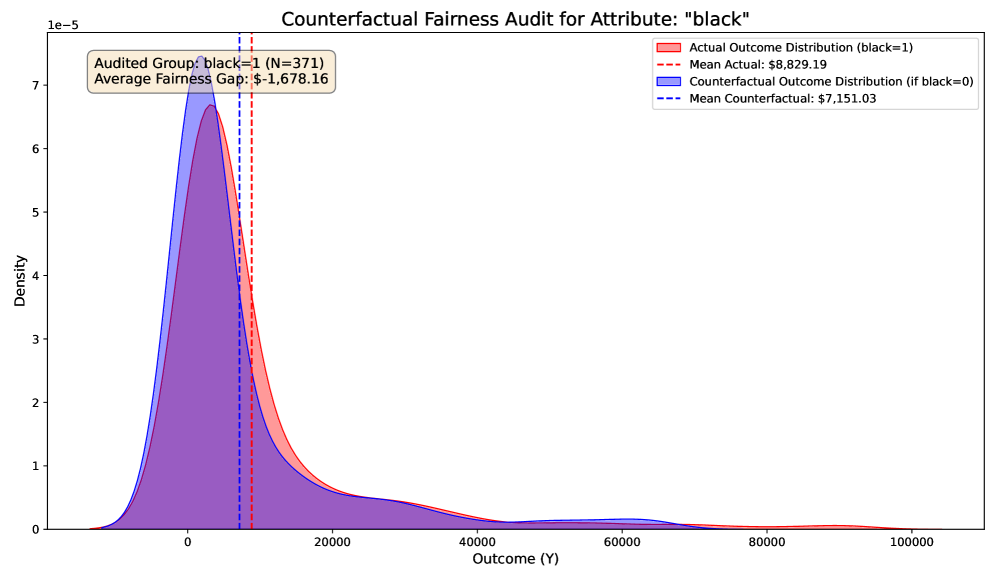
## Density Plot: Counterfactual Fairness Audit for Attribute "black"
### Overview
This image presents a density plot comparing the actual outcome distribution and the counterfactual outcome distribution for the attribute "black". The plot is used to assess fairness, specifically the average fairness gap. The plot displays density on the y-axis and outcome (Y) on the x-axis.
### Components/Axes
* **Title:** Counterfactual Fairness Audit for Attribute: "black"
* **X-axis Label:** Outcome (Y) - Scale ranges from 0 to 100000.
* **Y-axis Label:** Density - Scale ranges from 0 to 7e-5 (0.00007).
* **Audited Group:** black=1 (N=371)
* **Average Fairness Gap:** $-1,678.16
* **Legend:**
* Actual Outcome Distribution (black=1) - Represented by a solid red fill.
* Mean Actual - Represented by a dashed red line. Value: $8,829.19
* Counterfactual Outcome Distribution (if black=0) - Represented by a solid purple fill.
* Mean Counterfactual - Represented by a dashed blue line. Value: $7,151.03
### Detailed Analysis
The plot shows two overlapping density curves.
* **Actual Outcome Distribution (red):** The density is highest around 0, rapidly decreasing. There's a long tail extending towards higher outcome values, but the density remains low beyond approximately 20,000. The peak density is approximately 6.5e-5.
* **Counterfactual Outcome Distribution (purple):** The density is also highest around 0, but the curve is broader and flatter than the actual outcome distribution. The peak density is approximately 5.5e-5. The tail extends similarly to the actual distribution, but appears slightly more pronounced.
* **Mean Actual (dashed red):** A vertical dashed red line is positioned at approximately 8,829 on the x-axis.
* **Mean Counterfactual (dashed blue):** A vertical dashed blue line is positioned at approximately 7,151 on the x-axis.
The distributions overlap significantly, but the actual outcome distribution is shifted slightly to the right (higher outcome values) compared to the counterfactual distribution.
### Key Observations
* The average fairness gap is negative (-$1,678.16), indicating that, on average, individuals in the audited group (black=1) have a higher actual outcome than their counterfactual outcome (if black=0).
* The actual outcome distribution has a sharper peak and a slightly longer tail than the counterfactual distribution.
* The mean actual outcome is higher than the mean counterfactual outcome.
* The sample size for the audited group is 371.
### Interpretation
This plot suggests a potential fairness concern. The negative fairness gap indicates that the model tends to predict a more favorable outcome for individuals identified as "black" compared to what the outcome would be if they were not identified as such. This could be due to various factors, including bias in the training data or the model's decision-making process.
The difference in the shapes of the distributions suggests that the impact of the "black" attribute is not uniform across all outcome values. The sharper peak in the actual outcome distribution might indicate that the model is more confident in its predictions for certain individuals within the audited group.
The fact that the mean actual outcome is higher than the mean counterfactual outcome further supports the conclusion that the "black" attribute is associated with a more favorable predicted outcome. Further investigation is needed to understand the root cause of this disparity and to mitigate any potential unfairness. The values provided are approximate, based on visual estimation from the plot.