## Scatter Plot Comparison: Environmental Sound Characteristics
### Overview
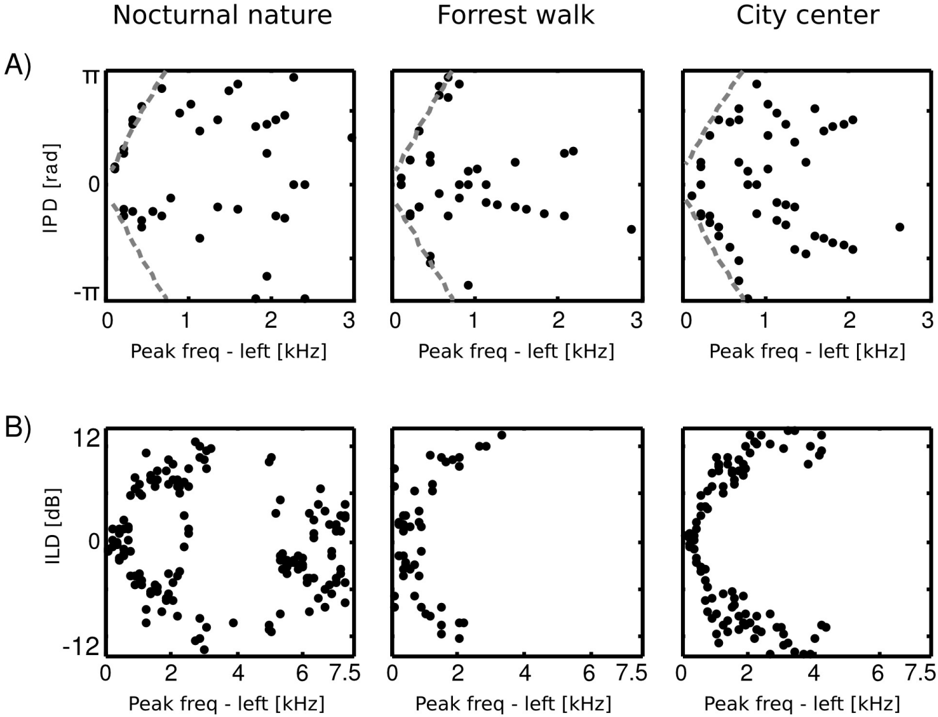
The image presents a series of scatter plots comparing the characteristics of environmental sounds in three different settings: "Nocturnal nature," "Forrest walk," and "City center." The plots are divided into two rows, labeled A and B. Row A displays the Interaural Phase Difference (IPD) in radians against the peak frequency in kHz. Row B displays the Interaural Level Difference (ILD) in decibels against the peak frequency in kHz. Each setting has its own column of plots, allowing for a visual comparison of the sound characteristics across environments.
### Components/Axes
**Row A (IPD vs. Peak Frequency):**
* **Y-axis (IPD [rad]):** Ranges from -π to π, with a marker at 0.
* **X-axis (Peak freq - left [kHz]):** Ranges from 0 to 3 kHz, with markers at 0, 1, 2, and 3.
* **Titles:** "Nocturnal nature" (left), "Forrest walk" (center), "City center" (right).
* **Dashed Line:** A gray dashed line is present in each plot, appearing to represent a boundary or threshold.
**Row B (ILD vs. Peak Frequency):**
* **Y-axis (ILD [dB]):** Ranges from -12 to 12, with a marker at 0.
* **X-axis (Peak freq - left [kHz]):** Ranges from 0 to 7.5 kHz, with markers at 0, 2, 4, 6, and 7.5.
* **Titles:** "Nocturnal nature" (left), "Forrest walk" (center), "City center" (right).
### Detailed Analysis
**Row A: IPD vs. Peak Frequency**
* **Nocturnal nature:** Data points are scattered across the plot. Most points are above the 0 IPD line.
* **Forrest walk:** Data points are concentrated towards the lower left, with a few scattered points.
* **City center:** Data points are clustered in the lower left, with a noticeable concentration below the dashed line.
**Row B: ILD vs. Peak Frequency**
* **Nocturnal nature:** Data points are widely distributed, forming a circular or ring-like pattern.
* **Forrest walk:** Data points are concentrated in the lower-left quadrant.
* **City center:** Data points are clustered in a curved shape, mostly above the -12 dB line.
### Key Observations
* **IPD:** The "City center" environment shows a concentration of data points below the dashed line, suggesting a distinct IPD characteristic compared to "Nocturnal nature" and "Forrest walk."
* **ILD:** The "Nocturnal nature" environment exhibits a unique circular distribution in the ILD plot, which is not observed in the other two environments. The "Forrest walk" environment has a concentration of points in the lower-left quadrant. The "City center" environment shows a curved distribution.
* **Frequency Range:** The peak frequency range is different between the IPD and ILD plots (0-3 kHz vs. 0-7.5 kHz).
### Interpretation
The scatter plots provide a visual representation of how sound characteristics (IPD and ILD) vary across different environments. The distinct patterns observed in each environment suggest that these acoustic features could be used to differentiate between them.
* The concentration of IPD values below the dashed line in the "City center" environment might indicate specific sound sources or acoustic properties prevalent in urban settings.
* The circular distribution of ILD values in "Nocturnal nature" could be related to the types of sounds present in natural nighttime environments (e.g., animal calls, wind).
* The clustering of ILD values in the lower-left quadrant for "Forrest walk" might reflect the acoustic characteristics of sounds in forested areas.
The differences in peak frequency distribution between the IPD and ILD plots suggest that these two acoustic features may be sensitive to different frequency ranges within the environmental sounds.