## Trajectory and Denoising Visualization
### Overview
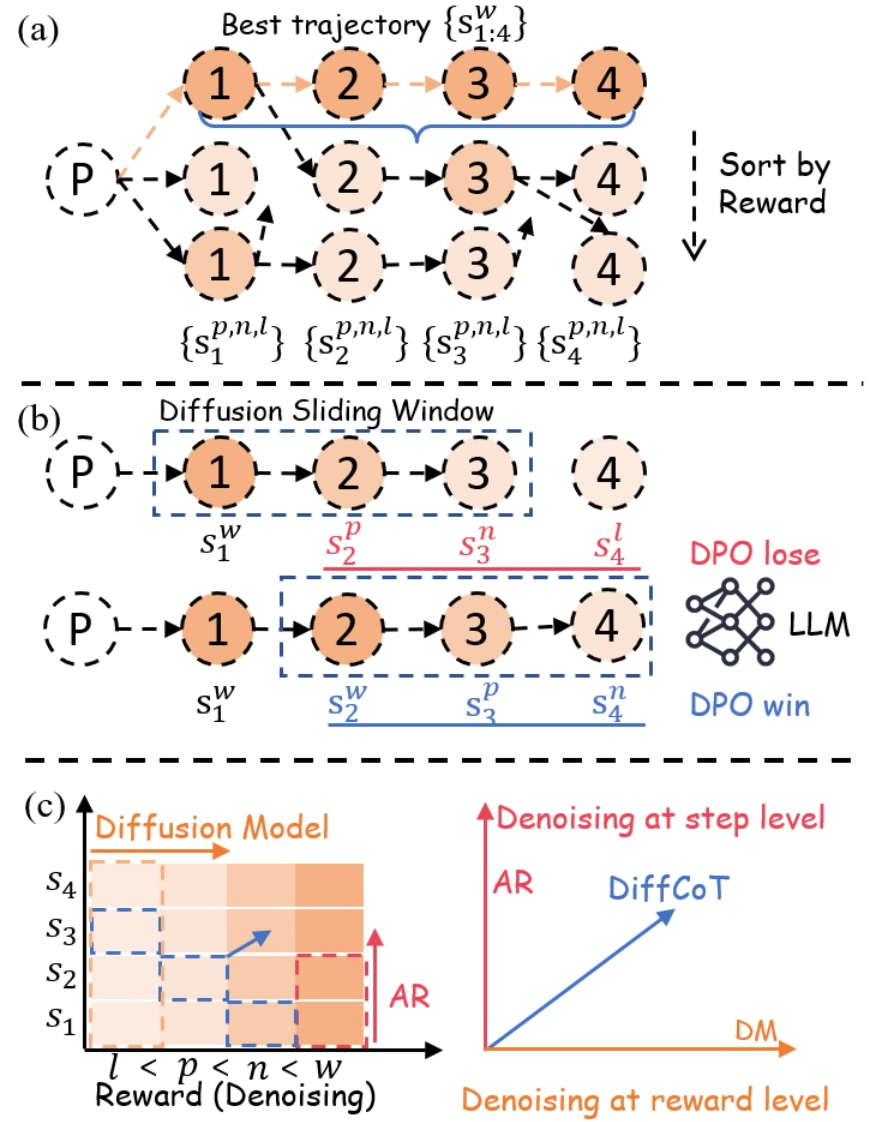
The image presents a multi-part diagram illustrating trajectory optimization and denoising processes. It consists of three sub-figures: (a) showing trajectory sorting by reward, (b) demonstrating a diffusion sliding window, and (c) visualizing denoising at both step and reward levels.
### Components/Axes
#### (a) Trajectory Sorting
* **Nodes:** Circular nodes labeled 1, 2, 3, and 4, representing states in a trajectory. A node labeled 'P' represents the starting point.
* **Arrows:** Dashed arrows indicate possible transitions between states. A solid blue line highlights the "Best trajectory" {S<sup>w</sup><sub>1:4</sub>}.
* **Text Labels:** "Best trajectory {S<sup>w</sup><sub>1:4</sub>}", "Sort by Reward", "{S<sup>p,n,l</sup><sub>1</sub>}", "{S<sup>p,n,l</sup><sub>2</sub>}", "{S<sup>p,n,l</sup><sub>3</sub>}", "{S<sup>p,n,l</sup><sub>4</sub>}".
#### (b) Diffusion Sliding Window
* **Nodes:** Similar to (a), circular nodes labeled 1, 2, 3, and 4, and a starting node 'P'.
* **Arrows:** Dashed arrows indicate transitions.
* **Rectangles:** A dashed blue rectangle labeled "Diffusion Sliding Window" encompasses nodes 1, 2, 3, and 4 in the top trajectory. A dashed red rectangle encompasses nodes 2, 3, and 4 in the bottom trajectory.
* **Text Labels:** "Diffusion Sliding Window", "S<sup>w</sup><sub>1</sub>", "S<sup>p</sup><sub>2</sub>", "S<sup>n</sup><sub>3</sub>", "S<sup>l</sup><sub>4</sub>", "S<sup>w</sup><sub>1</sub>", "S<sup>w</sup><sub>2</sub>", "S<sup>p</sup><sub>3</sub>", "S<sup>n</sup><sub>4</sub>", "DPO lose", "LLM", "DPO win". A neural network icon is placed between "DPO lose" and "LLM".
#### (c) Denoising Visualization
* **Axes:** A 2D plot with "Reward (Denoising)" on the x-axis and "Diffusion Model" on the y-axis.
* **Labels:** "Diffusion Model", "Denoising at step level", "Denoising at reward level", "AR", "DiffCoT", "DM", "l < p < n < w", "S1", "S2", "S3", "S4".
* **Gradient:** A color gradient from light to dark orange, increasing with both axes.
* **Arrows:** A red arrow labeled "AR" points upwards, and a blue arrow labeled "DiffCoT" points diagonally upwards and to the right.
### Detailed Analysis
#### (a) Trajectory Sorting
The diagram shows multiple possible trajectories starting from node 'P' and progressing through states 1, 2, 3, and 4. The trajectories are implicitly sorted by reward, with the top trajectory being the "Best trajectory". The blue line highlights the best trajectory.
#### (b) Diffusion Sliding Window
This section illustrates a sliding window approach. The top trajectory has a window encompassing all four states (1 to 4), while the bottom trajectory has a window shifted to the right, encompassing states 2 to 4. The labels S<sup>w</sup>, S<sup>p</sup>, S<sup>n</sup>, and S<sup>l</sup> likely represent different aspects or stages within the diffusion process (window, positive, negative, loss). The "DPO lose" and "DPO win" labels, along with the LLM (Large Language Model) icon, suggest a comparison or competition between trajectories, possibly using Direct Preference Optimization.
#### (c) Denoising Visualization
The plot visualizes the relationship between reward (or denoising level) and the diffusion model. The gradient indicates increasing denoising strength as you move up and to the right. The "AR" arrow suggests an increase in some attribute (possibly "autoregressive") with increasing reward, while "DiffCoT" (Diffusion Chain-of-Thought) increases with both reward and diffusion model strength. The inequality "l < p < n < w" likely refers to the relative denoising levels associated with the labels in part (b).
### Key Observations
* **Trajectory Optimization:** The diagram highlights the process of selecting the best trajectory from multiple possibilities based on reward.
* **Diffusion Sliding Window:** The sliding window technique is used to analyze trajectories in segments, potentially for optimization or preference learning.
* **Denoising Levels:** The denoising visualization shows how different methods (AR, DiffCoT) relate to reward and diffusion model strength.
### Interpretation
The image illustrates a system for optimizing trajectories using a diffusion model and a sliding window approach. The trajectories are sorted by reward, and the best trajectory is selected. The sliding window allows for localized analysis and optimization of the trajectory. The denoising visualization provides insights into the relationship between reward, diffusion model strength, and different denoising methods. The "DPO lose" and "DPO win" labels suggest a reinforcement learning framework where trajectories are compared and optimized based on preferences. The inequality "l < p < n < w" likely represents the order of denoising strength, where 'l' has the least denoising and 'w' has the most.