TECHNICAL ASSET FINGERPRINT
043471ea75b1ea450cf8c1ae
Click to view fullscreen
Press ESC or click to close
FOUND IN PAPERS
EXPERT: healer-alpha-free VERSION 1
RUNTIME: free/openrouter/healer-alpha
INTEL_VERIFIED
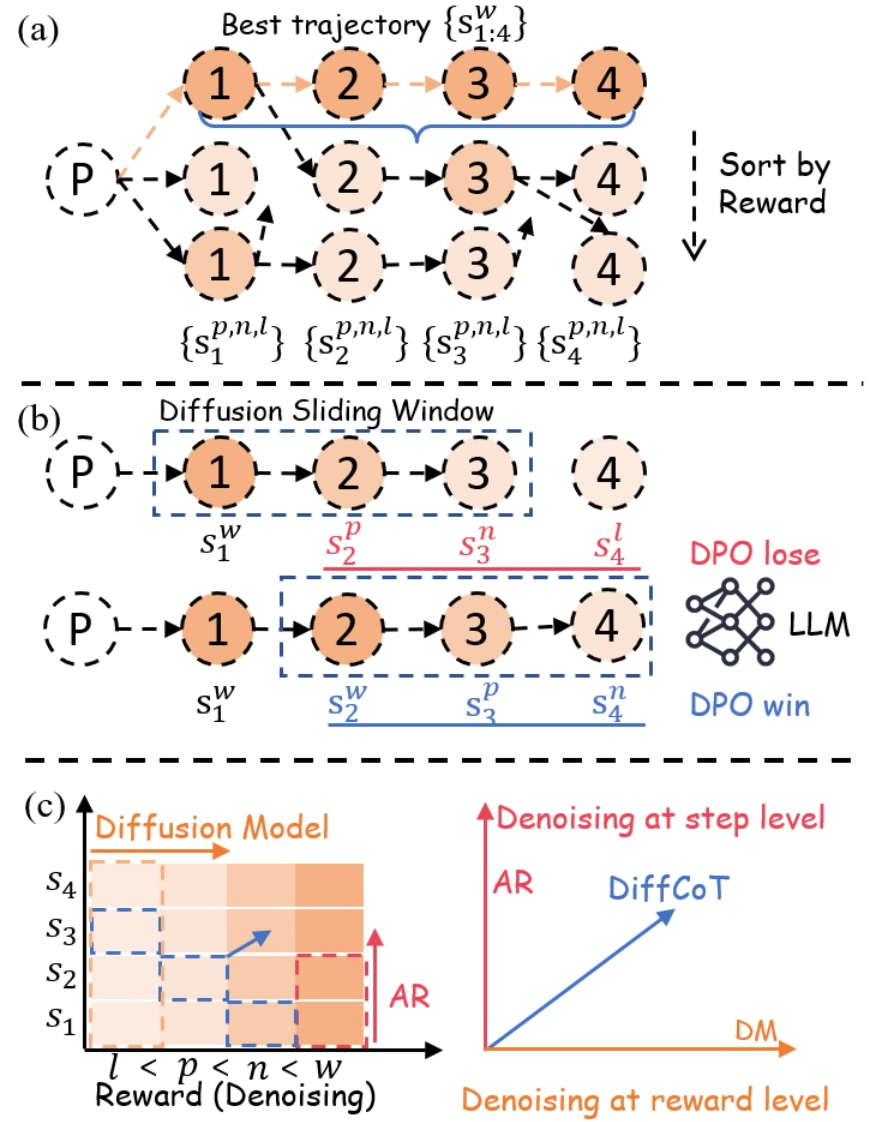
## Diagram: Diffusion-Based Trajectory Optimization and Reward-Level Denoising
### Overview
The image is a three-part technical diagram (labeled a, b, c) illustrating a machine learning methodology that combines diffusion models, autoregressive (AR) generation, and Direct Preference Optimization (DPO) for optimizing sequences or trajectories. It visually explains a process for selecting, comparing, and denoising sequences based on reward levels.
### Components/Axes
The diagram is divided into three horizontal panels:
* **(a) Top Panel:** Shows the generation and sorting of multiple trajectories from a starting point `P`.
* **(b) Middle Panel:** Illustrates a "Diffusion Sliding Window" mechanism applied to two different trajectories, linking them to DPO outcomes.
* **(c) Bottom Panel:** Contains two sub-charts.
* **Left Chart:** A 2D grid/heatmap with axes for "Reward (Denoising)" and step sequence (`s1` to `s4`).
* **Right Chart:** A 2D coordinate system with axes for "Denoising at step level" (AR) and "Denoising at reward level" (DM).
**Key Labels and Notation:**
* **Nodes:** Circles containing numbers `1`, `2`, `3`, `4` represent steps in a sequence.
* **Starting Point:** A dashed circle labeled `P`.
* **Trajectory Notation:**
* `{s_{1:4}^w}`: The "Best trajectory" (highlighted in orange).
* `{s_1^{p,n,l}}, {s_2^{p,n,l}}, {s_3^{p,n,l}}, {s_4^{p,n,l}}`: Other generated trajectories.
* **Superscript Legend (Reward Levels):** `w` (best), `p` (preferred), `n` (neutral), `l` (least preferred). This is explicitly shown in the x-axis of the left chart in (c): `l < p < n < w`.
* **Process Labels:**
* "Sort by Reward" (with a downward arrow) in panel (a).
* "Diffusion Sliding Window" in panel (b).
* "DPO lose" (red text) and "DPO win" (blue text) next to an "LLM" icon in panel (b).
* "Diffusion Model" (orange arrow) and "AR" (red arrow) in the left chart of (c).
* "Denoising at step level" (AR, red axis) and "Denoising at reward level" (DM, orange axis) in the right chart of (c).
* "DiffCoT" (blue arrow/line) in the right chart of (c).
### Detailed Analysis
#### Panel (a): Trajectory Generation and Sorting
* **Flow:** From a single prompt `P`, multiple sequences of 4 steps are generated.
* **Best Trajectory:** The top sequence `{s_{1:4}^w}` is highlighted with orange nodes and a blue bracket, indicating it has the highest reward (`w`).
* **Sorting:** Below the best trajectory, two other sequences are shown. A dashed arrow labeled "Sort by Reward" points downward, implying these sequences have lower rewards (likely `p`, `n`, or `l` as per the notation below them).
* **Spatial Grounding:** The best trajectory is positioned at the top. The "Sort by Reward" label and arrow are on the right side, aligned vertically with the lower trajectories.
#### Panel (b): Diffusion Sliding Window and DPO
* **Mechanism:** A dashed blue rectangle labeled "Diffusion Sliding Window" moves across the sequence steps.
* **Top Row (DPO lose):** The window covers steps 1-3 (`s1^w, s2^p, s3^n`). Step 4 (`s4^l`) is outside the window. This configuration is associated with "DPO lose" (red text).
* **Bottom Row (DPO win):** The window covers steps 2-4 (`s2^w, s3^p, s4^n`). Step 1 (`s1^w`) is outside the window. This configuration is associated with "DPO win" (blue text).
* **Interpretation:** This suggests that the choice of which steps are included in the diffusion window (the context for denoising/generation) affects the outcome of the DPO comparison, with one window placement leading to a "win" and the other to a "lose".
#### Panel (c): Denoising Paradigms
**Left Chart (Reward-Step Grid):**
* **Axes:**
* **X-axis (Reward/Denoising):** Ordered categories `l < p < n < w`.
* **Y-axis (Steps):** Sequence steps `s1, s2, s3, s4`.
* **Data Representation:** A grid of colored squares (shades of orange). The color intensity likely represents a value (e.g., probability, reward).
* **Trends/Arrows:**
* An orange arrow labeled "Diffusion Model" points horizontally to the right, indicating diffusion operates across reward levels at a given step.
* A red arrow labeled "AR" (Autoregressive) points vertically upward, indicating AR generation proceeds step-by-step at a given reward level.
* A blue dashed arrow points diagonally from the lower-left (`s1, l`) to the upper-right (`s4, w`), suggesting a path of improvement or the target trajectory.
**Right Chart (Denoising Space):**
* **Axes:**
* **X-axis:** "Denoising at reward level" (DM - Diffusion Model).
* **Y-axis:** "Denoising at step level" (AR - Autoregressive).
* **Data Series:** A single blue line labeled "DiffCoT" originating from the origin (0,0) and sloping upward to the right at approximately a 45-degree angle.
* **Trend:** The "DiffCoT" line shows a direct, positive correlation between denoising at the reward level and denoising at the step level. It represents a method that combines both paradigms.
### Key Observations
1. **Hierarchical Reward Structure:** The superscripts (`w, p, n, l`) establish a clear ranking of trajectory quality, which is central to the sorting and DPO processes.
2. **Sliding Window Importance:** Panel (b) highlights that the *context window* for diffusion is a critical design choice, directly influencing preference optimization outcomes (win/lose).
3. **Dual Denoising Axes:** Panel (c) formally decomposes the generation process into two orthogonal dimensions: step-wise (AR) and reward-wise (Diffusion). The "DiffCoT" method is presented as operating in the combined space of both.
4. **Visual Coding:** Colors are used consistently: orange for diffusion/best trajectories, red for AR/DPO lose, blue for DPO win/ DiffCoT/ sliding window.
### Interpretation
This diagram outlines a framework, likely for training or guiding Large Language Models (LLMs), that integrates diffusion models with reinforcement learning from human feedback (RLHF) via DPO.
* **What it suggests:** The core idea is to move beyond simple autoregressive next-token prediction. Instead, it proposes generating multiple candidate trajectories (a), ranking them by reward, and then using a diffusion process that operates over a sliding window of steps (b) to refine sequences. The DPO comparison ("win"/"lose") provides the learning signal to improve this refinement process.
* **How elements relate:** Panel (a) is the data generation and ranking step. Panel (b) is the core algorithmic innovation—the diffusion window—that acts on the ranked data. Panel (c) provides the theoretical framing, positioning the proposed "DiffCoT" method as a hybrid that performs denoising simultaneously in the step dimension (like traditional AR models) and the reward/dimension (like diffusion models), potentially offering more controllable and higher-quality generation.
* **Notable Anomalies/Insights:** The "DPO win" configuration in (b) uses a window shifted *forward* in the sequence (steps 2-4) compared to the "lose" configuration (steps 1-3). This might imply that for preference optimization, having the model focus on refining the *later* parts of a sequence, given good earlier context, is more effective than refining the beginning. The diagonal "DiffCoT" line in (c) posits that optimal denoising requires a balanced progression in both step and reward spaces, rather than excelling in only one.
DECODING INTELLIGENCE...