# Technical Document Extraction: 3D Surface and Scatter Plot Analysis
## 1. Image Overview
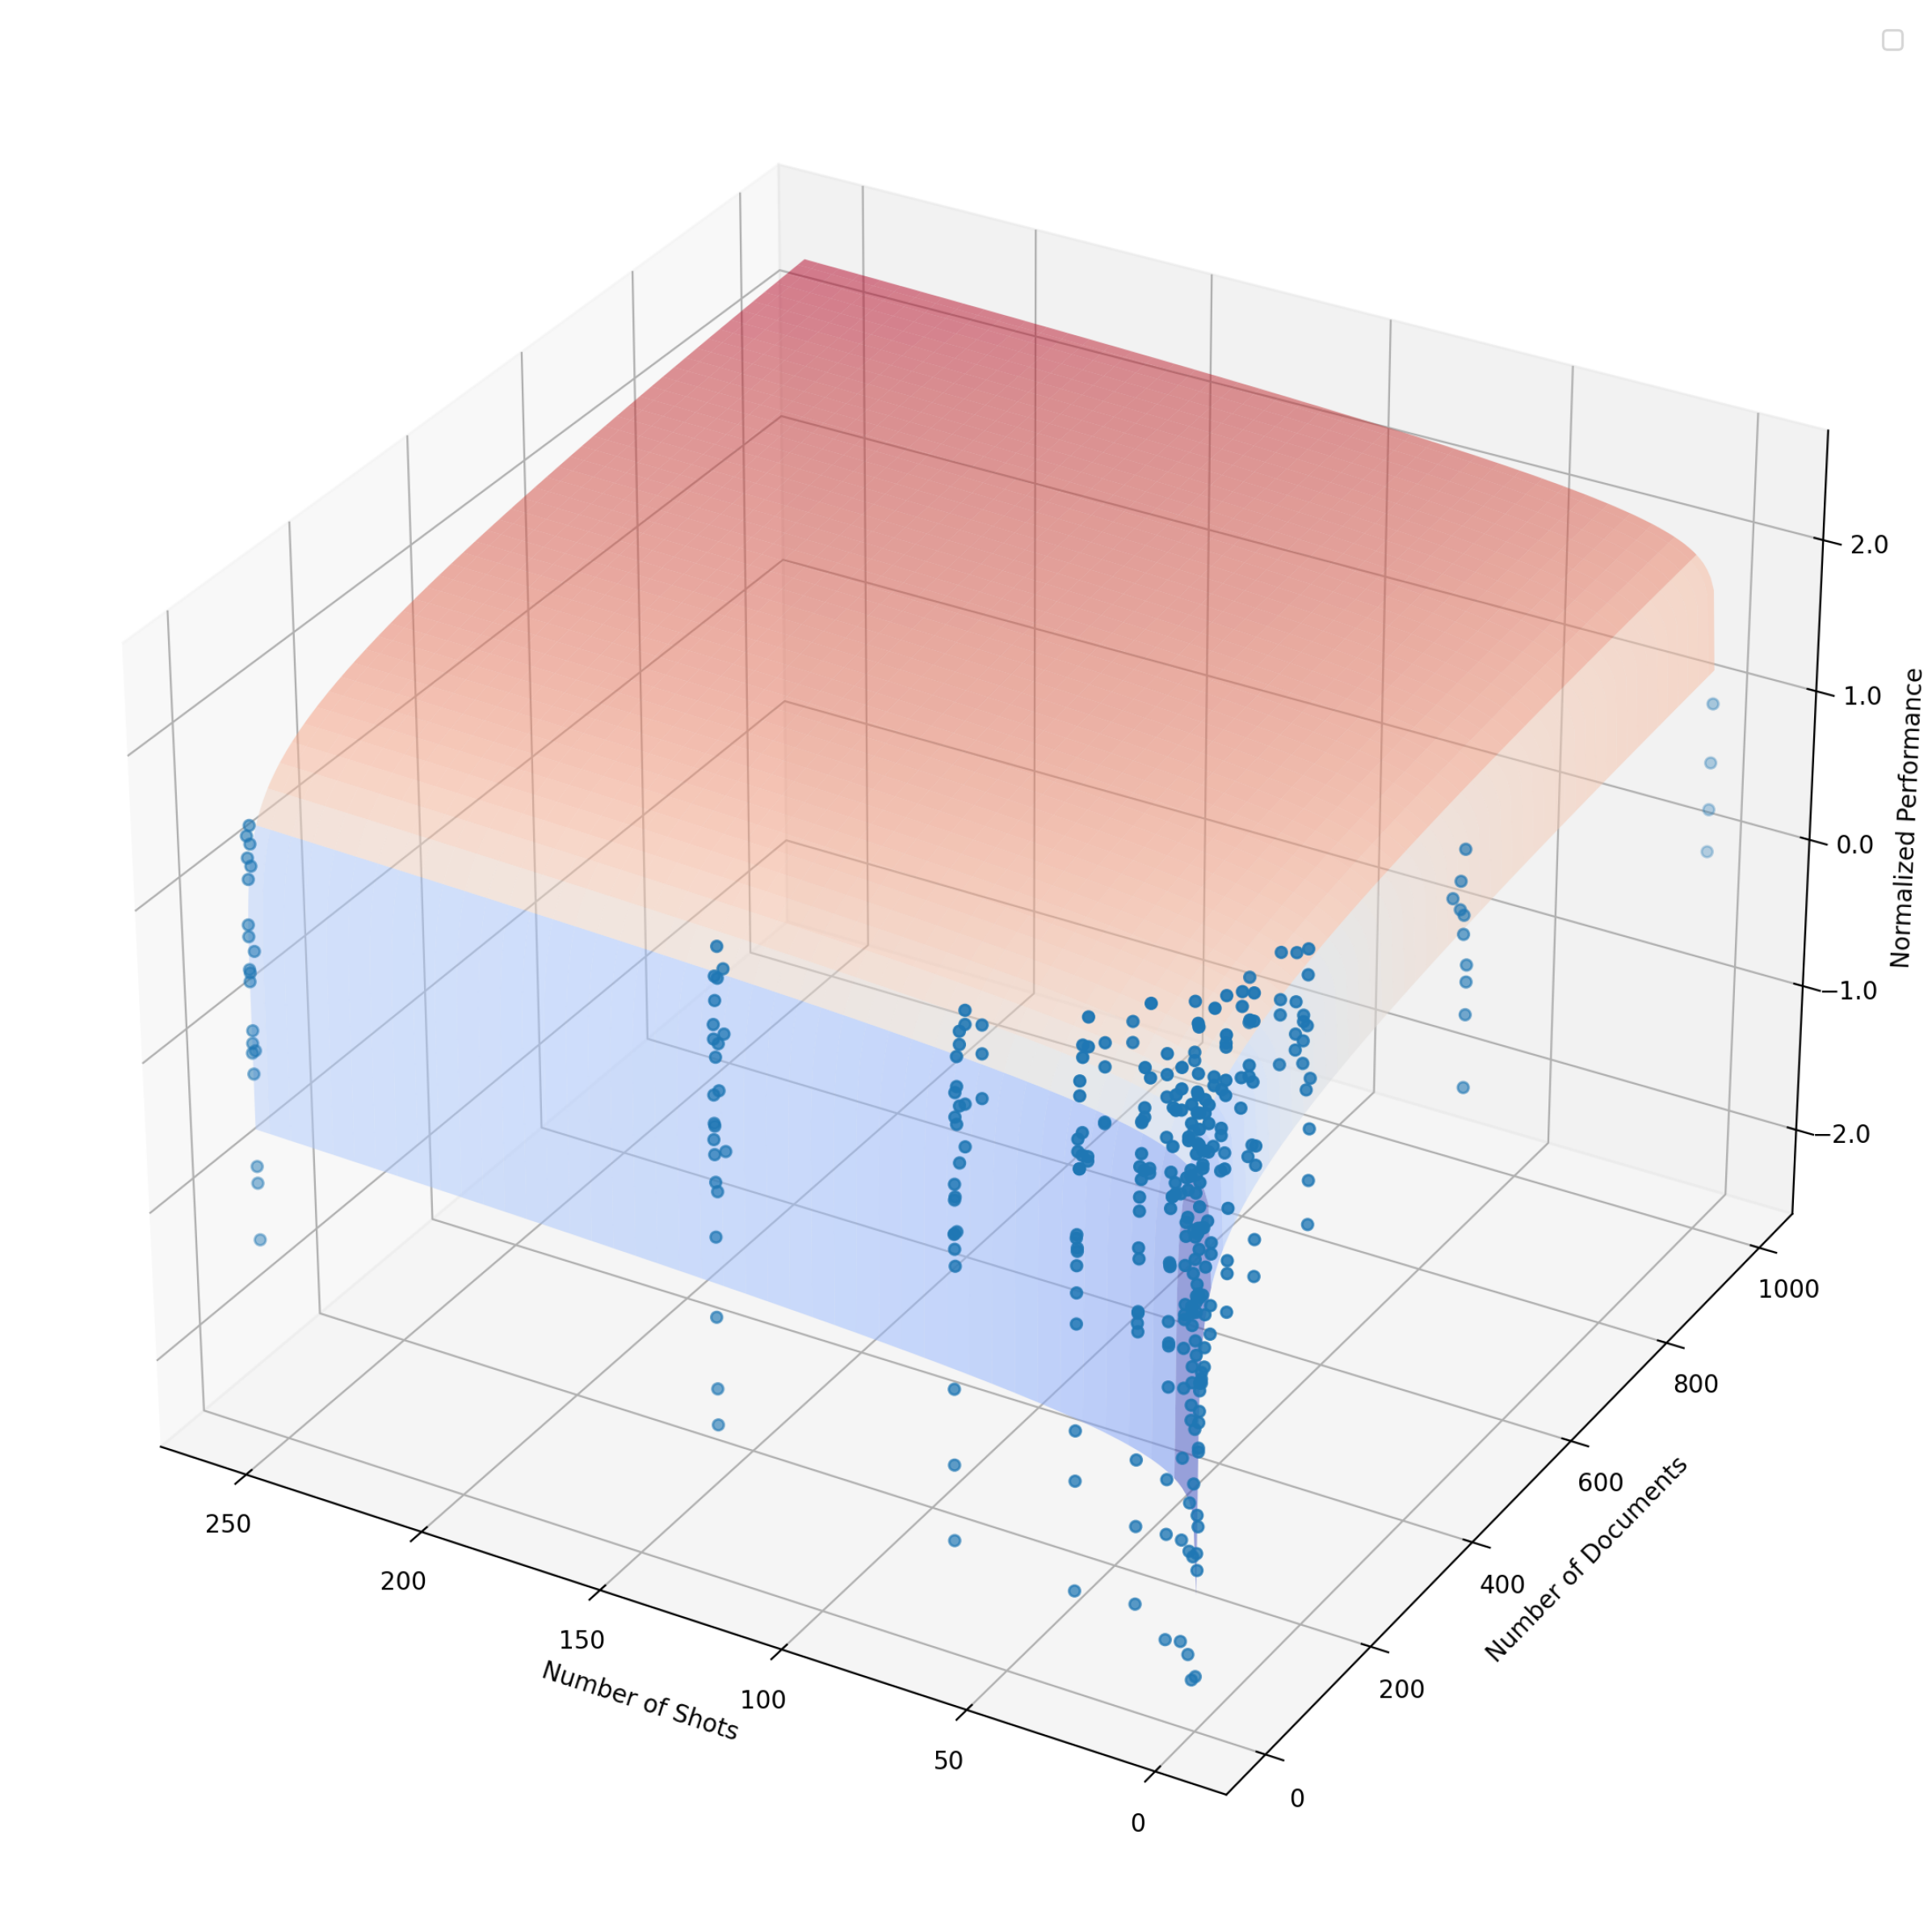
This image is a three-dimensional (3D) visualization combining a scatter plot of discrete data points with a fitted regression surface. It illustrates the relationship between two independent variables—**Number of Shots** and **Number of Documents**—and a dependent variable, **Normalized Performance**.
## 2. Component Isolation
### A. Header/Legend Region
* **Location:** Top right corner [x: ~950, y: ~20].
* **Content:** A small, empty legend box is present, but it contains no text or labels.
### B. Axis Definitions
The chart uses a 3D Cartesian coordinate system with the following axes:
| Axis | Label | Scale Range | Orientation |
| :--- | :--- | :--- | :--- |
| **X-Axis** | **Number of Shots** | 0 to 250 (Decreasing left-to-right) | Horizontal (Depth) |
| **Y-Axis** | **Number of Documents** | 0 to 1000 | Horizontal (Width) |
| **Z-Axis** | **Normalized Performance** | -2.0 to 2.0 | Vertical (Height) |
**Axis Markers:**
* **Number of Shots:** 0, 50, 100, 150, 200, 250.
* **Number of Documents:** 0, 200, 400, 600, 800, 1000.
* **Normalized Performance:** -2.0, -1.0, 0.0, 1.0, 2.0.
### C. Main Data Visualization
The visualization consists of two primary layers:
#### 1. Scatter Plot (Discrete Data)
* **Color:** Blue circular markers.
* **Distribution:** The points are clustered primarily at low values of "Number of Shots" (near 0) and "Number of Documents" (near 0).
* **Trend Verification:** As the "Number of Shots" increases toward 250, the density of data points decreases significantly. There are distinct vertical "columns" of data points at specific intervals of "Number of Shots" (e.g., at approximately 0, 32, 64, 128, and 256), suggesting these were fixed experimental parameters.
* **Performance Variance:** At low shot/document counts, the "Normalized Performance" (Z-axis) shows high variance, ranging from approximately -2.5 to 0.5.
#### 2. Regression Surface (Fitted Model)
* **Color Gradient:** A smooth surface transitioning from **Light Blue** (lower performance values) to **Red/Salmon** (higher performance values).
* **Trend Verification:**
* The surface slopes upward as both "Number of Shots" and "Number of Documents" increase.
* The slope is steepest at low values (near the origin) and begins to plateau as it approaches the higher bounds of the axes.
* The surface reaches its maximum "Normalized Performance" (approaching 2.0) at the back corner where "Number of Shots" is 250 and "Number of Documents" is 1000.
* **Curvature:** The surface exhibits a logarithmic or sub-linear growth pattern along both horizontal axes, indicating diminishing returns in performance as more shots or documents are added.
## 3. Key Data Insights and Trends
* **Positive Correlation:** There is a clear positive correlation between the input variables (Shots/Documents) and the output (Normalized Performance).
* **Data Sparsity:** While the model (the surface) predicts high performance at high shot/document counts, the actual data points (scatter) are sparse in those regions, particularly at the [250, 1000] coordinate.
* **Performance Range:** The "Normalized Performance" appears centered around 0.0 for mid-range inputs, with the model predicting a peak near 2.0 and a floor near -1.5 to -2.0 for minimal inputs.
## 4. Language Declaration
* **Primary Language:** English.
* **Other Languages:** None detected.