## Line Chart: Plot of (1 - std(X)) / std(X) for Bernoulli(p)
### Overview
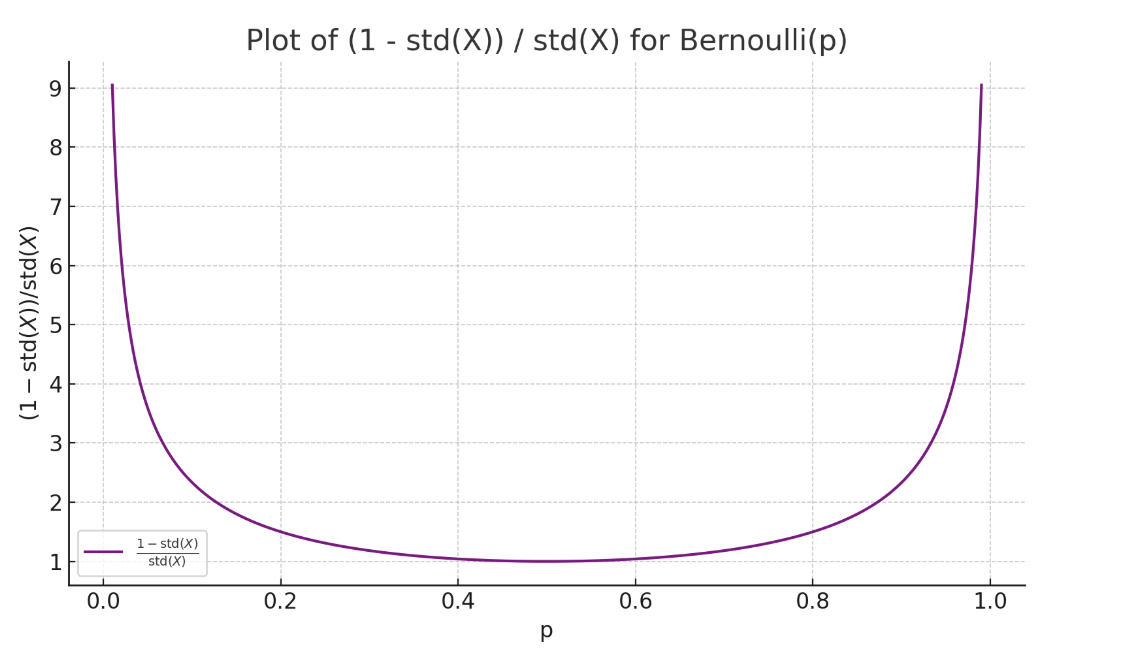
The image displays a mathematical plot representing the function $f(p) = \frac{1 - \text{std}(X)}{\text{std}(X)}$ for a Bernoulli random variable $X$ with parameter $p$. The plot visualizes how this specific ratio changes as the probability parameter $p$ varies between 0 and 1. The curve is a symmetric, U-shaped function that reaches its minimum at the center of the distribution.
### Components/Axes
* **Title:** "Plot of (1 - std(X)) / std(X) for Bernoulli(p)" centered at the top.
* **X-axis:** Labeled "p". The scale ranges from 0.0 to 1.0, with major tick marks at 0.0, 0.2, 0.4, 0.6, 0.8, and 1.0.
* **Y-axis:** Labeled "(1 - std(X))/std(X)". The scale ranges from 1 to 9, with major tick marks at 1, 2, 3, 4, 5, 6, 7, 8, and 9.
* **Legend:** Located in the bottom-left corner. It contains a purple line segment and the label "$\frac{1 - \text{std}(X)}{\text{std}(X)}$".
* **Grid:** A light gray dashed grid is overlaid on the plot area.
### Detailed Analysis
The data series is a single, continuous purple line.
**Trend Verification:**
The curve is convex (U-shaped). It starts at a very high value near $p=0$, descends rapidly to a minimum at $p=0.5$, and then ascends symmetrically back to a very high value near $p=1$.
**Data Points (Approximate values):**
* **Minimum:** At $p = 0.5$, the y-value is exactly 1.0.
* **Near Center:** At $p = 0.4$ and $p = 0.6$, the y-value is approximately 1.1.
* **Mid-range:** At $p = 0.2$ and $p = 0.8$, the y-value is approximately 1.5.
* **Rising Slope:** At $p = 0.1$ and $p = 0.9$, the y-value is approximately 3.0.
* **Steep Slope:** At $p = 0.05$ and $p = 0.95$, the y-value is approximately 6.0.
* **Asymptotic Behavior:** As $p$ approaches 0 or 1, the curve approaches infinity.
### Key Observations
* **Symmetry:** The plot is perfectly symmetric around the vertical axis $p = 0.5$.
* **Minimum Value:** The global minimum of the function is 1, occurring at the point of maximum variance for the Bernoulli distribution ($p=0.5$).
* **Asymptotes:** The function is undefined at $p=0$ and $p=1$ (where the standard deviation is 0), resulting in vertical asymptotes at these boundaries.
### Interpretation
This plot visualizes the relationship between the standard deviation of a Bernoulli distribution and the ratio $\frac{1 - \text{std}(X)}{\text{std}(X)}$.
For a Bernoulli random variable $X$ with parameter $p$, the variance is $\text{Var}(X) = p(1-p)$, meaning the standard deviation is $\text{std}(X) = \sqrt{p(1-p)}$.
* **At $p=0.5$:** The standard deviation is at its maximum ($\sqrt{0.25} = 0.5$). Consequently, the ratio is $\frac{1 - 0.5}{0.5} = 1$. This is the lowest point on the graph.
* **As $p$ moves toward 0 or 1:** The standard deviation $\sqrt{p(1-p)}$ approaches 0. As the denominator approaches 0, the entire fraction grows toward infinity.
Essentially, this chart demonstrates that the ratio is inversely proportional to the standard deviation of the Bernoulli distribution. The "uncertainty" (standard deviation) is highest at $p=0.5$, which minimizes this specific ratio, while the ratio explodes as the distribution becomes more deterministic (approaching $p=0$ or $p=1$).