## Chart: Plot of (1 - std(X)) / std(X) for Bernoulli(p)
### Overview
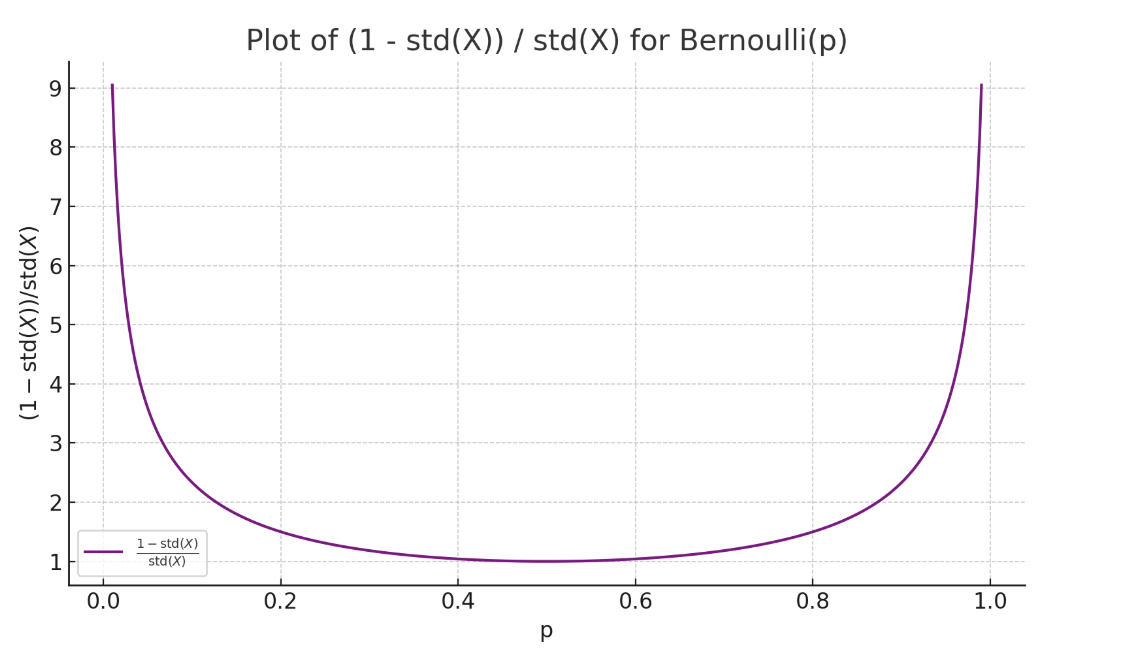
The image displays a line graph illustrating the relationship between the probability parameter 'p' of a Bernoulli distribution and the ratio (1 - std(X)) / std(X), where std(X) represents the standard deviation of the Bernoulli distribution. The graph shows a U-shaped curve, indicating a non-linear relationship between the two variables.
### Components/Axes
* **Title:** "Plot of (1 - std(X)) / std(X) for Bernoulli(p)" - positioned at the top-center of the chart.
* **X-axis:** Labeled "p", representing the probability parameter of the Bernoulli distribution. The scale ranges from 0.0 to 1.0, with markers at 0.0, 0.2, 0.4, 0.6, 0.8, and 1.0.
* **Y-axis:** Labeled "(1 - std(X)) / std(X)", representing the ratio of (1 - standard deviation) to the standard deviation. The scale ranges from approximately 1.0 to 9.0, with markers at 1, 2, 3, 4, 5, 6, 7, 8, and 9.
* **Legend:** Located in the bottom-left corner of the chart. It contains a single entry: "1 - std(X) / std(X)" associated with a solid black line.
### Detailed Analysis
The graph shows a single data series represented by a solid black line.
* **Trend:** The line exhibits a U-shaped curve. It starts at approximately y = 1.0 when x = 0.0, decreases to a minimum value of approximately y = 1.0 around x = 0.5, and then increases sharply to approximately y = 9.0 when x = 1.0.
* **Data Points (approximate):**
* (0.0, 1.0)
* (0.2, ~1.8)
* (0.4, ~2.5)
* (0.5, ~1.0)
* (0.6, ~2.5)
* (0.8, ~1.8)
* (1.0, 9.0)
### Key Observations
* The ratio (1 - std(X)) / std(X) is equal to 1 when p = 0 or p = 1.
* The ratio reaches a minimum value of approximately 1 when p = 0.5.
* The curve is symmetrical around p = 0.5.
* The ratio increases rapidly as p approaches 1.
### Interpretation
The graph demonstrates the relationship between the probability parameter 'p' of a Bernoulli distribution and a specific ratio involving its standard deviation. The U-shape indicates that the ratio is minimized when p = 0.5, meaning the difference between 1 and the standard deviation is smallest relative to the standard deviation itself at this probability. As 'p' moves away from 0.5, the ratio increases, suggesting a greater difference between 1 and the standard deviation relative to the standard deviation. This could be interpreted as the uncertainty (represented by the standard deviation) becoming more pronounced as the probability deviates from 0.5. The rapid increase near p=1 suggests a very high sensitivity to changes in 'p' when the probability is close to certainty. The graph provides a visual representation of how the standard deviation impacts this ratio across the range of possible Bernoulli probabilities.