## Line Chart: Plot of (1 - std(X)) / std(X) for Bernoulli(p)
### Overview
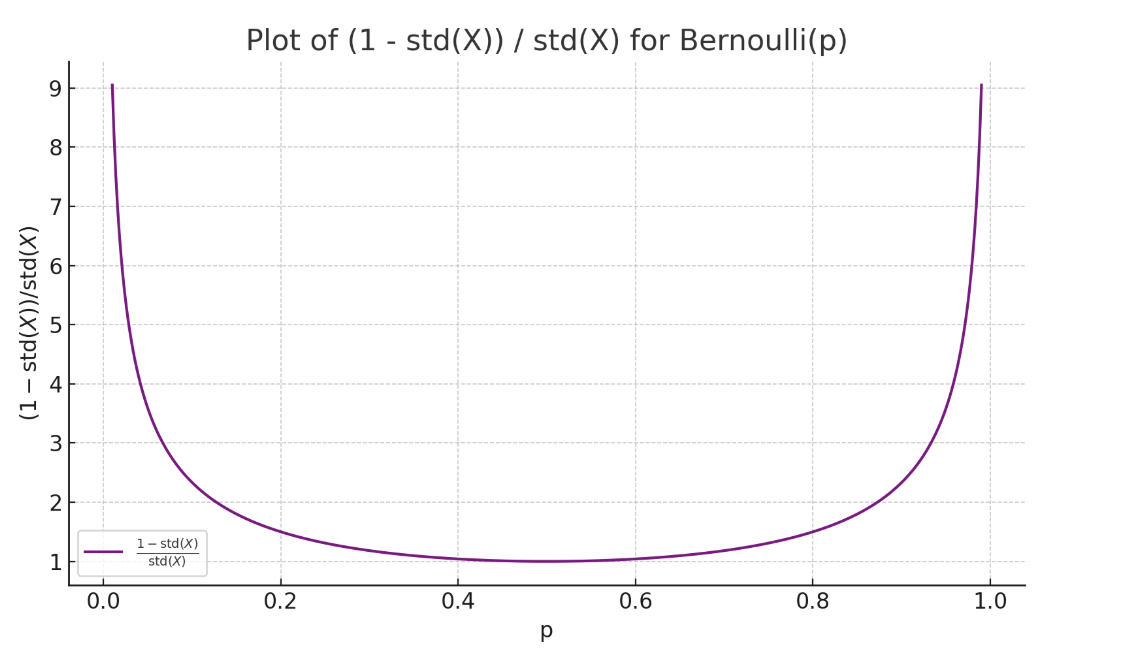
The chart visualizes the ratio of (1 - standard deviation of X) to standard deviation of X for a Bernoulli distribution parameterized by probability `p`. The y-axis represents the normalized ratio, while the x-axis spans the probability parameter `p` from 0.0 to 1.0. The curve exhibits a U-shaped trend, with the minimum value at `p = 0.5` and sharp increases toward the extremes (`p = 0.0` and `p = 1.0`).
### Components/Axes
- **X-axis (p)**: Labeled "p", ranging from 0.0 to 1.0 in increments of 0.2.
- **Y-axis**: Labeled "(1 - std(X))/std(X)", with values from 1 to 9.
- **Legend**: Located in the bottom-left corner, labeled "1 - std(X)/std(X)" with a purple line.
- **Line**: A single purple curve representing the ratio, plotted across the full range of `p`.
### Detailed Analysis
- **At `p = 0.5`**: The ratio reaches its minimum value of approximately **1.0**, indicating maximum variability in the Bernoulli distribution.
- **At `p = 0.2` and `p = 0.8`**: The ratio increases to ~**3.0**, reflecting reduced variability as `p` moves away from 0.5.
- **At `p = 0.1` and `p = 0.9`**: The ratio rises to ~**5.0**, showing further suppression of variability.
- **At `p = 0.0` and `p = 1.0`**: The ratio peaks at **9.0**, where the Bernoulli distribution becomes deterministic (no variability).
- **Trend**: The curve is symmetric around `p = 0.5`, with a smooth U-shape. No discontinuities or outliers are observed.
### Key Observations
1. The ratio inversely correlates with the standard deviation of the Bernoulli distribution.
2. Extremes of `p` (0.0 and 1.0) yield the highest ratio values, indicating minimal variability.
3. The minimum ratio at `p = 0.5` aligns with the maximum variance of the Bernoulli distribution.
### Interpretation
This plot demonstrates how the Bernoulli distribution's variability changes with `p`. When `p = 0.5`, the distribution is most uncertain (highest variance), resulting in the lowest ratio. As `p` approaches 0 or 1, the distribution becomes deterministic (e.g., always 0 or always 1), reducing variance and inflating the ratio. The sharp increase near the extremes highlights the sensitivity of the ratio to changes in `p` when the distribution is near certainty. This relationship is critical for understanding how parameter uncertainty impacts statistical measures in binary outcomes.