\n
## Bar Chart: Comparison Across Methods on Collaborative Tasks
### Overview
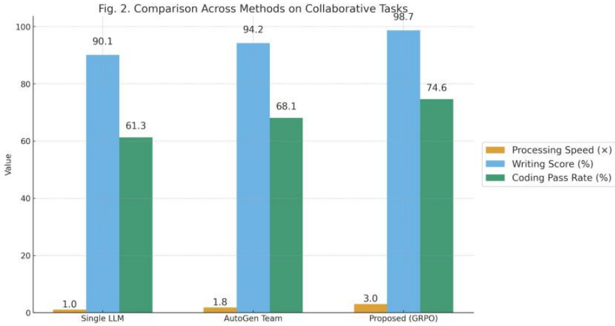
This image presents a bar chart comparing three methods – Single LLM, AutoGen Team, and Proposed (GRPO) – across three metrics: Processing Speed, Writing Score, and Coding Pass Rate. The chart uses bar heights to represent values, with each method having three bars corresponding to the three metrics.
### Components/Axes
* **Title:** "Fig. 2. Comparison Across Methods on Collaborative Tasks" (Top-center)
* **X-axis:** Methods – "Single LLM", "AutoGen Team", "Proposed (GRPO)" (Bottom-center)
* **Y-axis:** "Value" (Left-center), ranging from 0 to 100, with increments of 20.
* **Legend:** Located in the top-right corner.
* Orange: "Processing Speed (x)"
* Blue: "Writing Score (%)"
* Green: "Coding Pass Rate (%)"
### Detailed Analysis
The chart consists of three groups of bars, one for each method. Within each group, there are three bars representing the three metrics.
**Single LLM:**
* Processing Speed (Orange): Approximately 1.0
* Writing Score (Blue): Approximately 90.1
* Coding Pass Rate (Green): Approximately 61.3
**AutoGen Team:**
* Processing Speed (Orange): Approximately 1.8
* Writing Score (Blue): Approximately 94.2
* Coding Pass Rate (Green): Approximately 68.1
**Proposed (GRPO):**
* Processing Speed (Orange): Approximately 3.0
* Writing Score (Blue): Approximately 98.7
* Coding Pass Rate (Green): Approximately 74.6
The bars for each metric within a method group are visually distinct based on the legend colors. The Writing Score bars are consistently the highest for all three methods. The Coding Pass Rate bars are the lowest. The Processing Speed bars are significantly lower than the other two metrics.
### Key Observations
* The "Proposed (GRPO)" method consistently outperforms the other two methods across all three metrics.
* The "AutoGen Team" method shows improvement over the "Single LLM" method in all metrics.
* Processing Speed is significantly lower than both Writing Score and Coding Pass Rate for all methods.
* The difference in Writing Score between "Single LLM" and "AutoGen Team" is relatively small, but the difference between "AutoGen Team" and "Proposed (GRPO)" is more substantial.
* The Coding Pass Rate shows the most significant improvement from "Single LLM" to "Proposed (GRPO)".
### Interpretation
The data suggests that the "Proposed (GRPO)" method is the most effective approach for collaborative tasks, demonstrating superior performance in processing speed, writing quality, and coding accuracy. The improvement from "Single LLM" to "AutoGen Team" indicates the benefits of utilizing a team-based approach. The substantial gains achieved by "Proposed (GRPO)" suggest that the specific techniques employed in this method are particularly well-suited for enhancing collaborative task performance.
The low values for Processing Speed relative to the other metrics might indicate that the speed is a limiting factor, or that the other metrics are more important for the overall success of the tasks. The increasing Coding Pass Rate across the methods suggests that the methods are becoming more reliable in generating correct code. The consistent high Writing Score indicates that all methods are capable of producing high-quality written content.
The chart provides a clear visual comparison of the strengths and weaknesses of each method, allowing for informed decision-making regarding the selection of the most appropriate approach for collaborative tasks.