## Chart: Optimal Panning Gains for Varying Acoustic Power Targets
### Overview
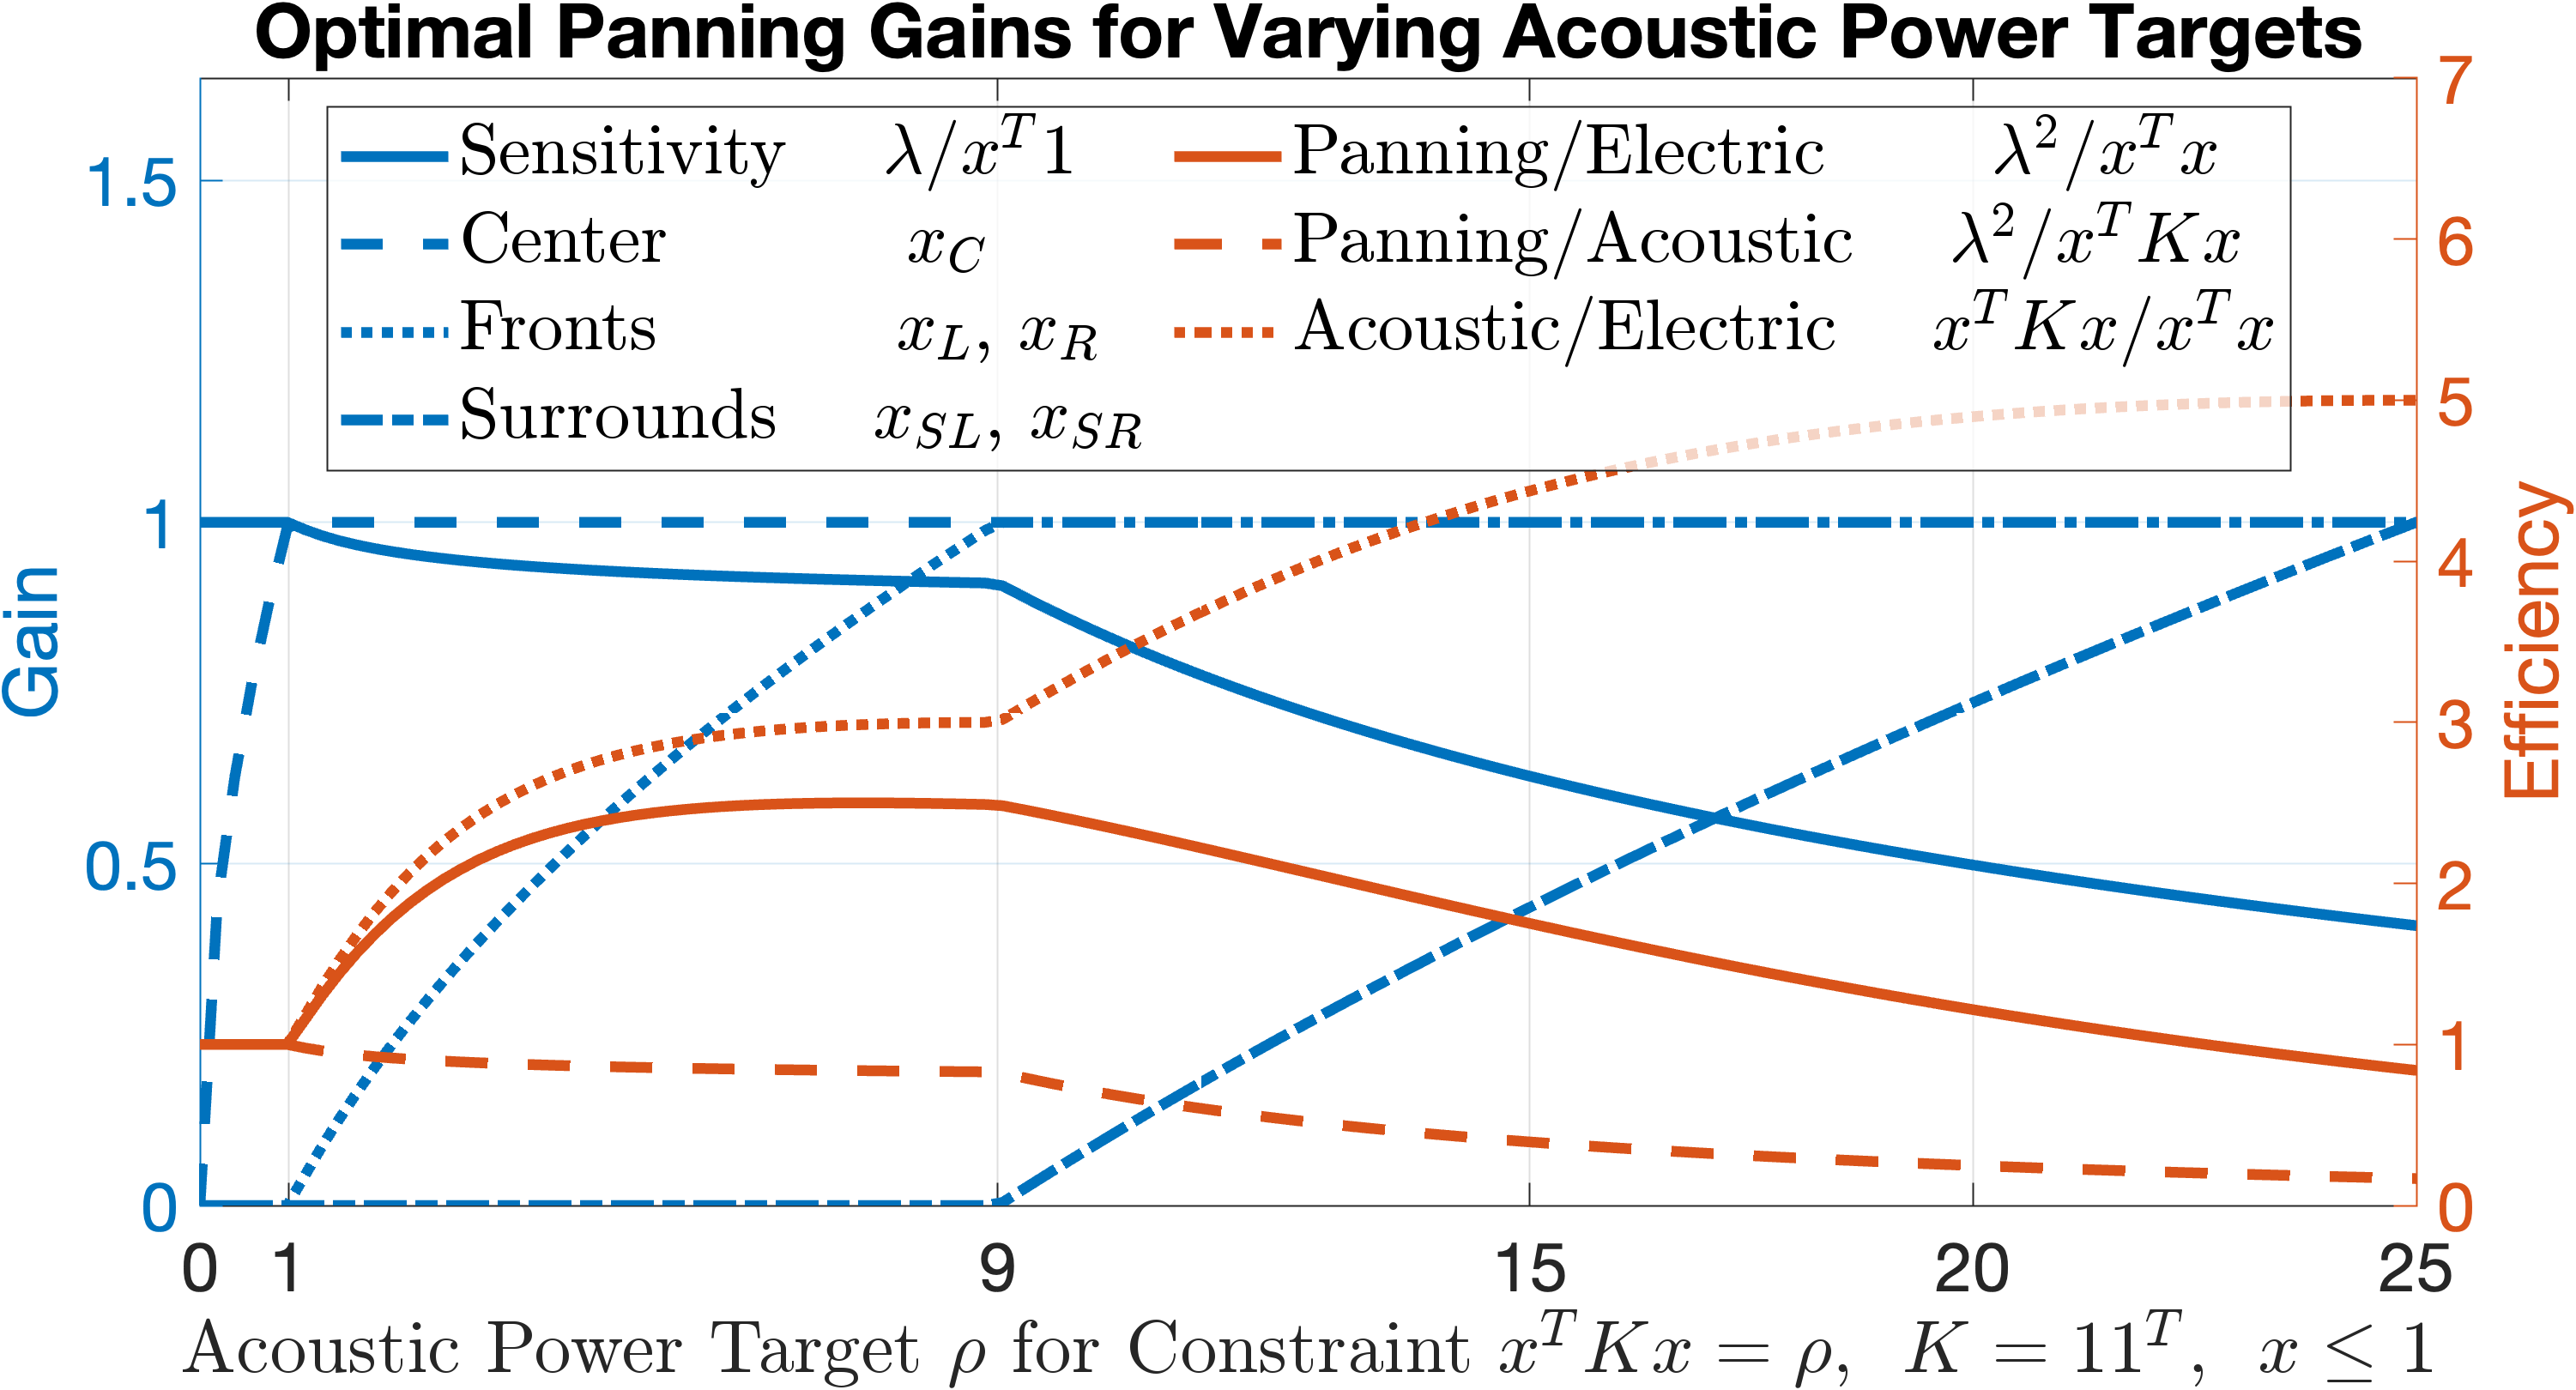
The image is a line chart that displays the relationship between acoustic power target (ρ) and various gain and efficiency metrics. The x-axis represents the acoustic power target ρ, while the left y-axis represents "Gain" and the right y-axis represents "Efficiency". Several lines represent different panning strategies and their corresponding gains or efficiencies.
### Components/Axes
* **Title:** Optimal Panning Gains for Varying Acoustic Power Targets
* **X-axis:**
* Label: Acoustic Power Target ρ for Constraint xᵀKx = ρ, K = 11ᵀ, x ≤ 1
* Scale: 0 to 25, with major ticks at 0, 1, 9, 15, 20, and 25.
* **Left Y-axis:**
* Label: Gain
* Scale: 0 to 1.5, with major ticks at 0, 0.5, 1, and 1.5.
* **Right Y-axis:**
* Label: Efficiency
* Scale: 0 to 7, with major ticks at 0, 1, 2, 3, 4, 5, 6, and 7.
* **Legend:** Located at the top-center of the chart.
* **Sensitivity (Solid Blue):** λ/xᵀ1
* **Center (Dashed Blue):** xC
* **Fronts (Dotted Blue):** xL, xR
* **Surrounds (Dash-Dot Blue):** xSL, xSR
* **Panning/Electric (Solid Orange):** λ²/xᵀx
* **Panning/Acoustic (Dashed Orange):** λ²/xᵀKx
* **Acoustic/Electric (Dotted Orange):** xᵀKx/xᵀx
### Detailed Analysis
* **Sensitivity (Solid Blue):** Starts at a gain of approximately 1.0 at ρ = 0, remains constant until ρ = 1, then decreases to approximately 0.4 at ρ = 25.
* **Center (Dashed Blue):** Starts at a gain of approximately 0 at ρ = 0, remains constant until ρ = 9, then increases linearly to approximately 1.0 at ρ = 25.
* **Fronts (Dotted Blue):** Starts at a gain of approximately 0 at ρ = 0, increases to approximately 0.9 at ρ = 9, then increases slightly to approximately 1.0 at ρ = 25.
* **Surrounds (Dash-Dot Blue):** Starts at a gain of approximately 0.2 at ρ = 0, remains constant at approximately 0.2 until ρ = 1, then increases to approximately 0.4 at ρ = 25.
* **Panning/Electric (Solid Orange):** Starts at an efficiency of approximately 1.0 at ρ = 0, increases to approximately 2.5 at ρ = 1, then increases to approximately 3.0 at ρ = 9, then decreases to approximately 1.0 at ρ = 25.
* **Panning/Acoustic (Dashed Orange):** Starts at an efficiency of approximately 0.2 at ρ = 0, remains constant at approximately 0.2 until ρ = 25.
* **Acoustic/Electric (Dotted Orange):** Starts at an efficiency of approximately 1.0 at ρ = 0, increases to approximately 5.0 at ρ = 25.
### Key Observations
* The "Sensitivity" gain decreases as the acoustic power target increases beyond a value of 1.
* The "Center" gain increases linearly with the acoustic power target after a value of 9.
* The "Fronts" gain increases rapidly initially and then plateaus.
* The "Surrounds" gain increases linearly with the acoustic power target after a value of 1.
* The "Panning/Electric" efficiency initially increases and then decreases as the acoustic power target increases.
* The "Panning/Acoustic" efficiency remains relatively constant regardless of the acoustic power target.
* The "Acoustic/Electric" efficiency increases steadily with the acoustic power target.
### Interpretation
The chart illustrates how different panning strategies perform in terms of gain and efficiency as the acoustic power target changes. The "Sensitivity" gain decreases with increasing acoustic power, suggesting that it might be less effective at higher power targets. The "Center" gain increases, indicating that it becomes more prominent at higher power targets. The "Fronts" gain quickly reaches a plateau, suggesting a limited dynamic range. The "Surrounds" gain increases steadily, indicating a consistent contribution across different power targets. The efficiency metrics show how effectively each panning strategy utilizes power. The "Panning/Electric" efficiency peaks and then declines, suggesting an optimal power target range. The "Panning/Acoustic" efficiency remains constant, indicating a consistent power usage. The "Acoustic/Electric" efficiency increases, suggesting that it becomes more efficient at higher power targets.