\n
## Chart: Optimal Panning Gains for Varying Acoustic Power Targets
### Overview
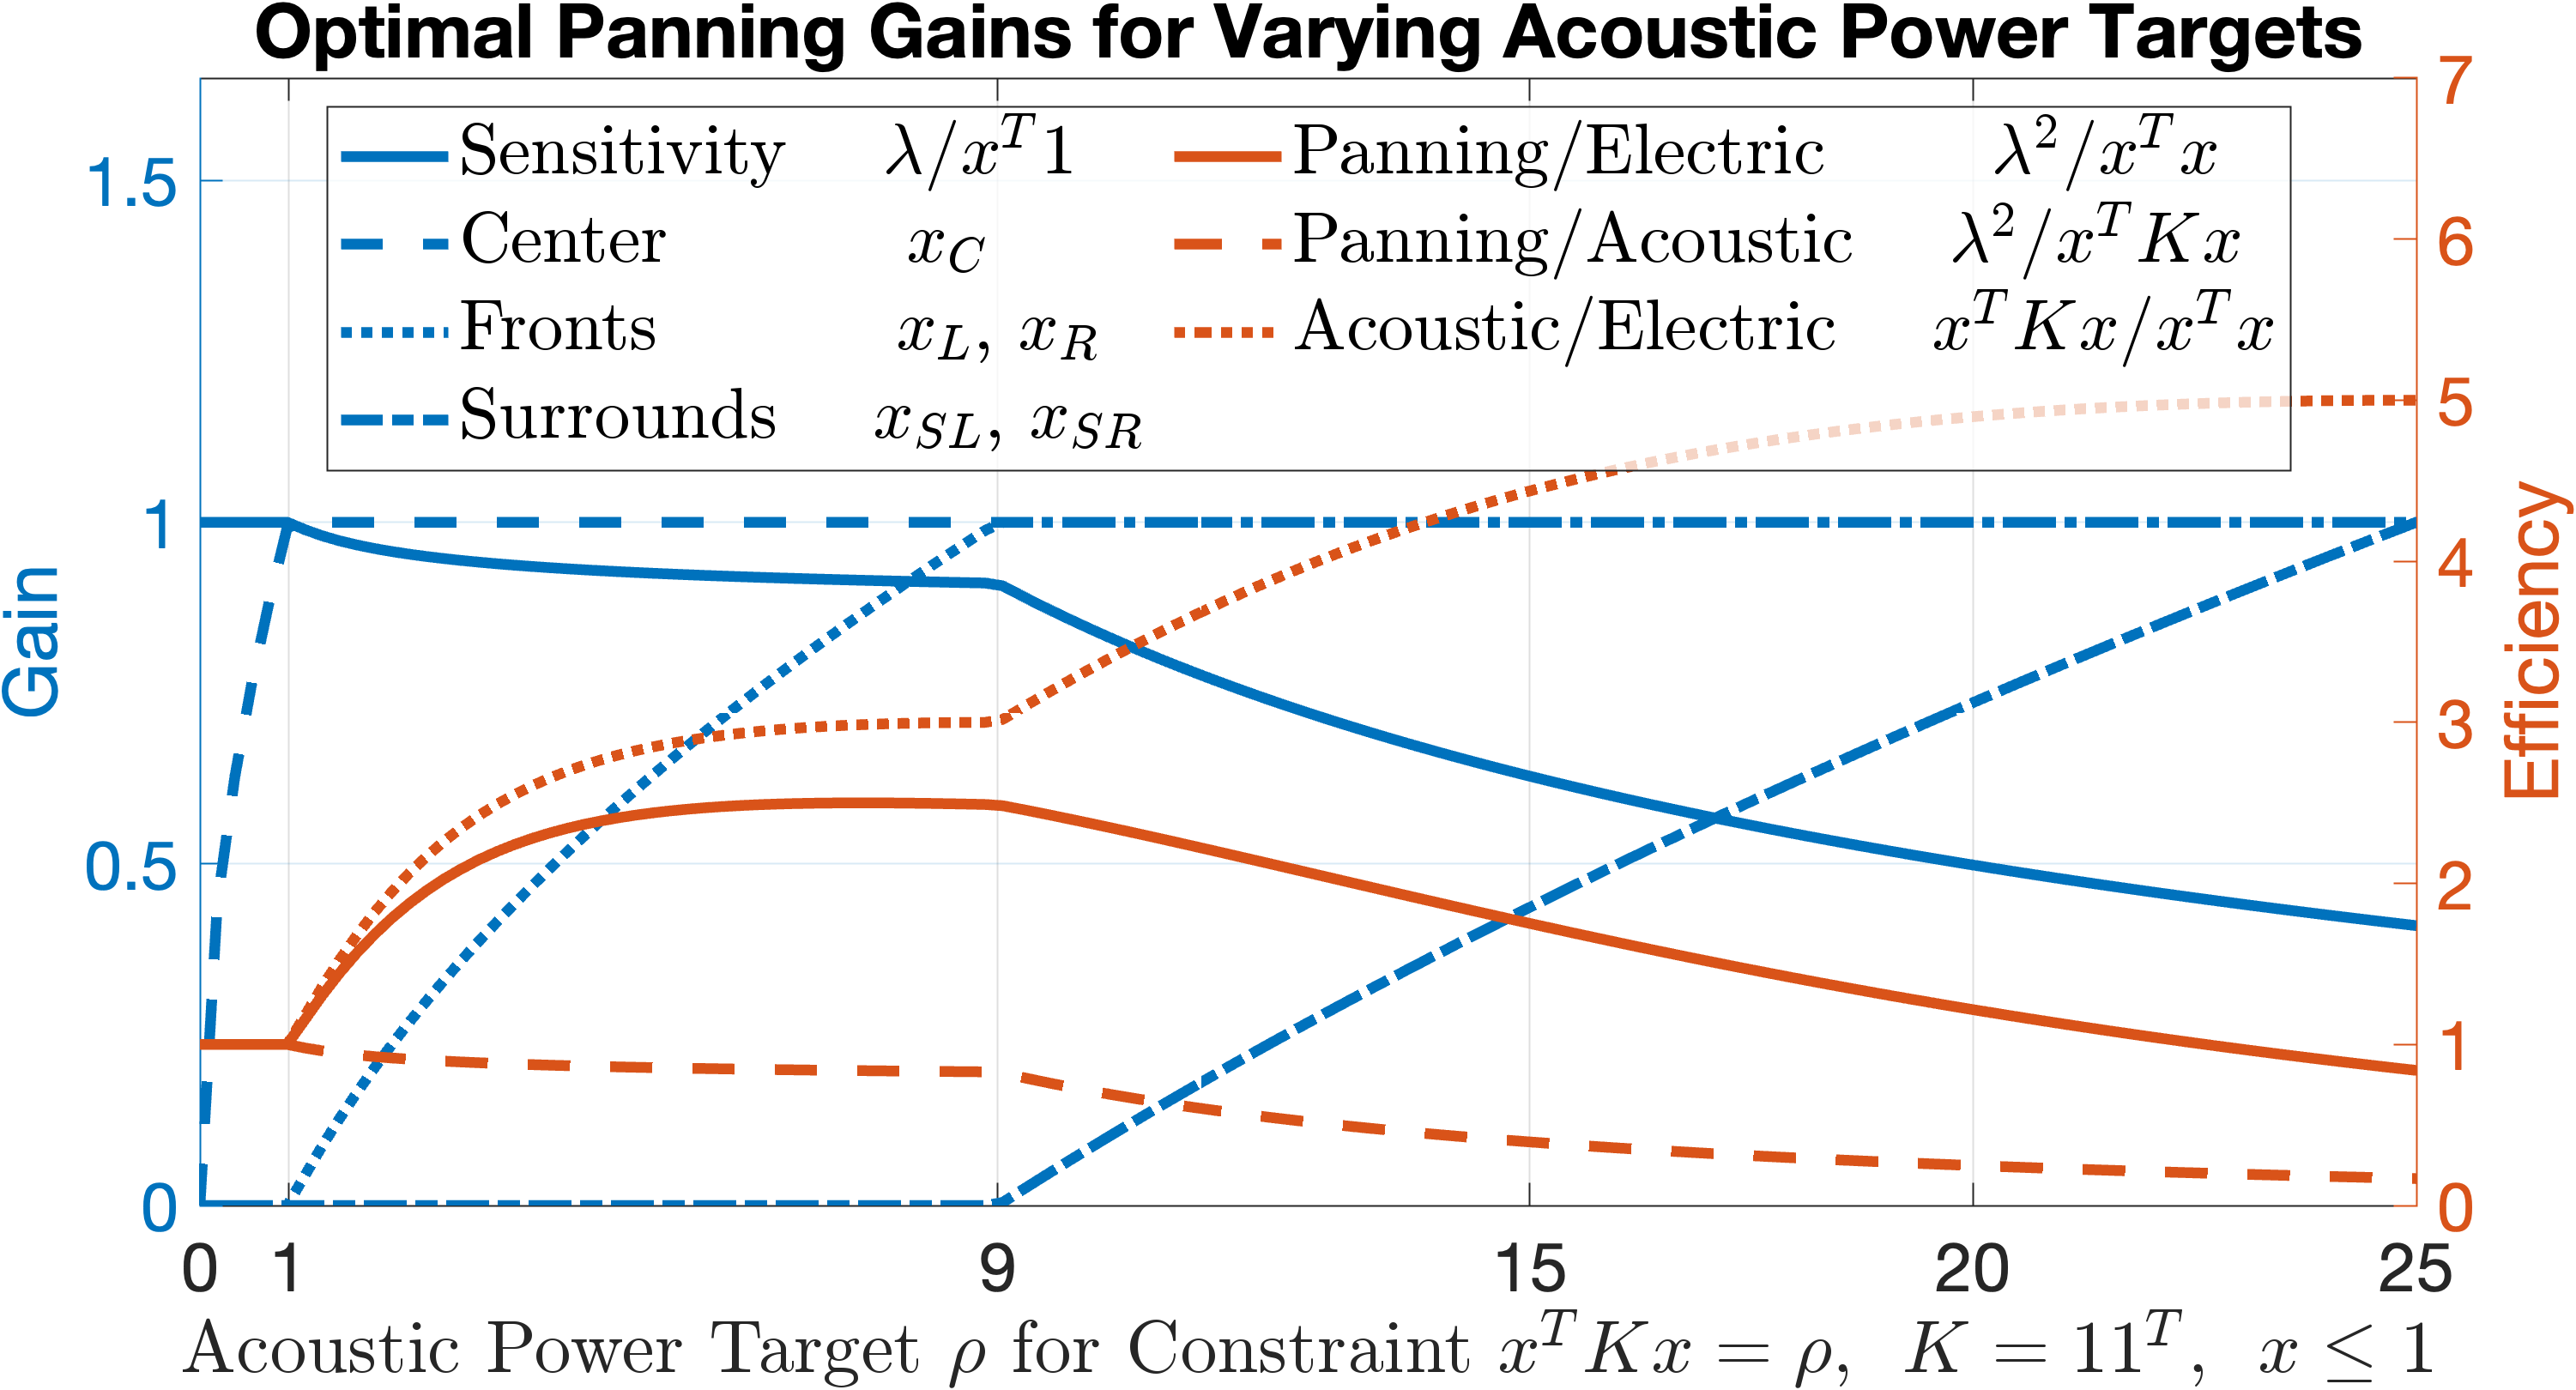
The image presents a line chart illustrating the relationship between "Acoustic Power Target" (x-axis) and "Gain" (left y-axis) and "Efficiency" (right y-axis) for various panning configurations. The chart explores optimal panning gains under a constraint defined by `xᵀKx = ρ`, where `K = 11ᵀ` and `x ≤ 1`. Multiple lines represent different panning strategies (Sensitivity, Center, Fronts, Surrounds, Panning/Electric, Panning/Acoustic, Acoustic/Electric).
### Components/Axes
* **Title:** Optimal Panning Gains for Varying Acoustic Power Targets
* **X-axis:** Acoustic Power Target ρ for Constraint `xᵀKx = ρ`, `K = 11ᵀ`, `x ≤ 1`. Scale ranges from 0 to 25.
* **Left Y-axis:** Gain. Scale ranges from 0 to 1.5.
* **Right Y-axis:** Efficiency. Scale ranges from 0 to 7.
* **Legend:** Located at the top-right of the chart. Contains the following entries with corresponding colors:
* Sensitivity (Blue) - `λ/xᵀ 1`
* Center (Dark Blue, dashed) - `x_C`
* Fronts (Dark Blue, dotted) - `x_L, x_R`
* Surrounds (Dark Blue, dash-dot) - `x_SL, x_SR`
* Panning/Electric (Orange) - `λ²/xᵀ x`
* Panning/Acoustic (Dark Orange, dashed) - `λ²/xᵀ Kx`
* Acoustic/Electric (Brown) - `xᵀ Kx/xᵀ x`
### Detailed Analysis
The chart displays several lines, each representing a different panning gain strategy as a function of the acoustic power target.
* **Sensitivity (Blue):** Starts at approximately 0.1 at ρ = 0, decreases to a minimum of approximately 0.05 at ρ = 7, then increases sharply to approximately 1.3 at ρ = 25.
* **Center (Dark Blue, dashed):** Starts at approximately 1.1 at ρ = 0, decreases steadily to approximately 0.8 at ρ = 25.
* **Fronts (Dark Blue, dotted):** Starts at approximately 0.8 at ρ = 0, decreases steadily to approximately 0.6 at ρ = 25.
* **Surrounds (Dark Blue, dash-dot):** Starts at approximately 0.6 at ρ = 0, decreases to approximately 0.2 at ρ = 7, then increases to approximately 0.4 at ρ = 25.
* **Panning/Electric (Orange):** Starts at approximately 1.0 at ρ = 0, decreases steadily to approximately 0.5 at ρ = 25.
* **Panning/Acoustic (Dark Orange, dashed):** Starts at approximately 0.5 at ρ = 0, decreases to approximately 0.1 at ρ = 7, then increases to approximately 0.3 at ρ = 25.
* **Acoustic/Electric (Brown):** Starts at approximately 0.2 at ρ = 0, decreases steadily to approximately 0.05 at ρ = 25.
The right y-axis (Efficiency) shows corresponding values for each line.
* **Sensitivity (Blue):** Efficiency increases from approximately 1 at ρ = 0 to approximately 6 at ρ = 25.
* **Center (Dark Blue, dashed):** Efficiency decreases from approximately 4 at ρ = 0 to approximately 3 at ρ = 25.
* **Fronts (Dark Blue, dotted):** Efficiency decreases from approximately 5 at ρ = 0 to approximately 4 at ρ = 25.
* **Surrounds (Dark Blue, dash-dot):** Efficiency decreases from approximately 3 at ρ = 0 to approximately 1 at ρ = 7, then increases to approximately 2 at ρ = 25.
* **Panning/Electric (Orange):** Efficiency decreases from approximately 2 at ρ = 0 to approximately 1 at ρ = 25.
* **Panning/Acoustic (Dark Orange, dashed):** Efficiency decreases from approximately 3 at ρ = 0 to approximately 1 at ρ = 25.
* **Acoustic/Electric (Brown):** Efficiency decreases from approximately 0 at ρ = 0 to approximately 0 at ρ = 25.
### Key Observations
* The "Sensitivity" line exhibits the most dramatic change in gain, increasing significantly at higher acoustic power targets.
* The "Center" line maintains a relatively stable gain across the entire range of acoustic power targets.
* The "Acoustic/Electric" line consistently shows the lowest gain and efficiency.
* The "Surrounds" line shows a dip in gain and efficiency around ρ = 7.
* The "Panning/Acoustic" line shows a dip in gain and efficiency around ρ = 7.
### Interpretation
This chart investigates the trade-offs between different panning strategies and their efficiency as the acoustic power target changes. The constraint `xᵀKx = ρ` likely represents a limitation on the total energy or power available for panning. The lines represent how the gain (amplification) needs to be adjusted for each panning configuration to achieve optimal performance under this constraint.
The steep increase in "Sensitivity" gain at higher acoustic power targets suggests that this strategy becomes increasingly effective as more power is available. Conversely, the relatively stable "Center" gain indicates that this strategy is less sensitive to changes in acoustic power. The low gain and efficiency of "Acoustic/Electric" suggest that this strategy is less effective overall.
The dips observed in the "Surrounds" and "Panning/Acoustic" lines around ρ = 7 might indicate resonance or other non-linear effects at that specific acoustic power target. These points could represent areas where the panning strategy becomes less stable or efficient.
The chart provides valuable insights for optimizing panning configurations in acoustic systems, allowing designers to select the most appropriate strategy based on the available acoustic power and desired performance characteristics. The mathematical expressions associated with each line (e.g., `λ/xᵀ 1`) likely define the specific panning algorithms or configurations being evaluated.