\n
## Diagram: Stepped Overhang
### Overview
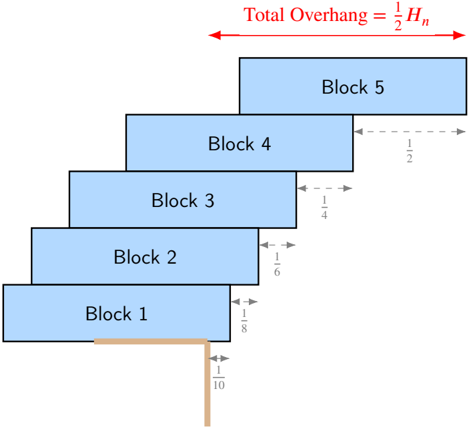
The image depicts a diagram illustrating a stepped overhang structure composed of five rectangular blocks stacked upon each other, with decreasing length. The diagram highlights the total overhang distance as a fraction of a height, denoted as *H<sub>n</sub>*. Each block is labeled sequentially from Block 1 at the bottom to Block 5 at the top. Overhang distances are indicated for each block relative to the block below it.
### Components/Axes
* **Blocks:** Five rectangular blocks labeled "Block 1" through "Block 5", stacked in descending order of length.
* **Overhang Arrows:** Arrows indicating the overhang distance of each block.
* **Total Overhang Label:** "Total Overhang = 1/2 * H<sub>n</sub>" in red text, positioned at the top-center of the diagram.
* **Overhang Values:** Numerical values representing the overhang distance for each block, expressed as fractions (1/10, 1/8, 1/6, 1/4, 1/2).
* **Vertical Support:** A vertical line representing the support structure, extending from the bottom of Block 1.
### Detailed Analysis
The diagram shows a series of blocks with progressively increasing overhangs. The overhang distances are as follows:
* **Block 1:** Overhang = 1/10
* **Block 2:** Overhang = 1/8
* **Block 3:** Overhang = 1/6
* **Block 4:** Overhang = 1/4
* **Block 5:** Overhang = 1/2
The total overhang is defined as one-half of a height, *H<sub>n</sub>*. The diagram does not provide a value for *H<sub>n</sub>*. The overhangs increase as the blocks ascend.
### Key Observations
* The overhang distances are not linearly increasing; they are increasing, but at a decreasing rate.
* The total overhang is directly proportional to *H<sub>n</sub>*.
* The diagram illustrates a structural concept where the center of mass of each block must be supported by the block below it to maintain stability.
### Interpretation
This diagram likely represents a simplified model of a cantilevered structure or a system demonstrating the principle of static equilibrium. The increasing overhangs demonstrate how the load distribution changes with each successive block. The total overhang being half of *H<sub>n</sub>* suggests a specific relationship between the overall height of the structure and the maximum extension. The diagram is a visual aid for understanding the concept of overhang and its relationship to structural stability. The fractional values for the overhangs suggest a mathematical or engineering context, potentially related to calculations of stress, strain, or center of gravity. The diagram is not providing specific data, but rather illustrating a principle. It is a conceptual representation, and the values are likely used to demonstrate a relationship rather than represent a real-world measurement.