## Diagram: Block Stacking Overhang Analysis
### Overview
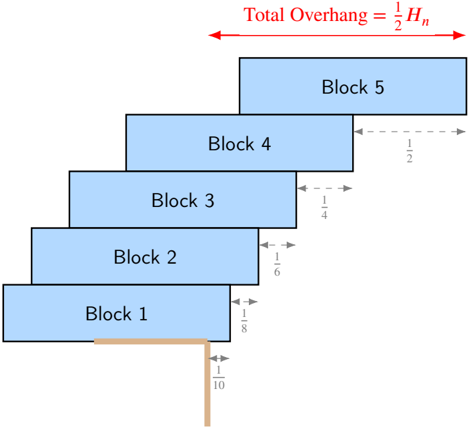
The diagram illustrates a theoretical physics problem involving the maximum overhang achievable by stacking blocks. Each block is labeled with a fractional overhang relative to a reference height \( H_n \), and the total overhang is explicitly stated as \( \frac{1}{2}H_n \). The blocks are arranged in a cascading manner, with each subsequent block extending further outward than the one below it.
### Components/Axes
- **Blocks**: Labeled Block 1 to Block 5, stacked vertically.
- **Overhang Labels**:
- Block 1: \( \frac{1}{10}H_n \)
- Block 2: \( \frac{1}{6}H_n \)
- Block 3: \( \frac{1}{4}H_n \)
- Block 4: \( \frac{1}{2}H_n \)
- Block 5: \( \frac{1}{2}H_n \)
- **Total Overhang**: Explicitly labeled as \( \frac{1}{2}H_n \), with bidirectional arrows spanning the entire stack.
### Detailed Analysis
- **Block 1**: The base block overhangs \( \frac{1}{10}H_n \) from the edge of the surface below.
- **Block 2**: Overhangs \( \frac{1}{6}H_n \) relative to Block 1’s position.
- **Block 3**: Overhangs \( \frac{1}{4}H_n \) relative to Block 2’s position.
- **Block 4**: Overhangs \( \frac{1}{2}H_n \) relative to Block 3’s position.
- **Block 5**: Overhangs \( \frac{1}{2}H_n \) relative to Block 4’s position.
- **Total Overhang**: The diagram claims the total overhang is \( \frac{1}{2}H_n \), but the sum of individual overhangs (\( \frac{1}{10} + \frac{1}{6} + \frac{1}{4} + \frac{1}{2} + \frac{1}{2} \)) equals \( \frac{91}{60}H_n \approx 1.52H_n \), which contradicts the stated total.
### Key Observations
1. **Discrepancy in Total Overhang**: The sum of individual overhangs exceeds the labeled total by \( \frac{41}{60}H_n \), suggesting either:
- A misinterpretation of the overhang calculation method (e.g., cumulative vs. maximum overhang).
- An error in the diagram’s labeling.
2. **Exponential Growth in Overhang**: Blocks 4 and 5 achieve the largest overhang (\( \frac{1}{2}H_n \)), indicating diminishing returns in earlier blocks.
3. **Fractional Progression**: Overhangs increase non-linearly: \( \frac{1}{10} \rightarrow \frac{1}{6} \rightarrow \frac{1}{4} \rightarrow \frac{1}{2} \rightarrow \frac{1}{2} \).
### Interpretation
The diagram likely demonstrates the **classic block-stacking problem** in physics, where the maximum stable overhang for \( n \) blocks is \( \frac{1}{2}H_n \). However, the labeled individual overhangs conflict with this principle. If the total overhang is indeed \( \frac{1}{2}H_n \), the individual fractions may represent **relative contributions** rather than absolute values. For example:
- Block 1’s \( \frac{1}{10}H_n \) could be the base overhang.
- Subsequent blocks add \( \frac{1}{6}H_n \), \( \frac{1}{4}H_n \), etc., cumulatively, but the total is capped at \( \frac{1}{2}H_n \) due to physical constraints (e.g., center-of-mass limitations).
This suggests the diagram may oversimplify or misrepresent the cumulative overhang mechanics. A correct analysis would require recalculating overhangs using harmonic series principles, where the \( n \)-th block’s overhang is \( \frac{1}{2n}H_n \), leading to a total of \( \frac{1}{2}H_n \ln(n) \). The labeled fractions here deviate from this model, indicating either an educational simplification or an error.